Volatility indices (Vol 10 and Vol 10 1s) are some of the tradeable assets offered by Deriv. They are synthetic indices pairs which moves in the company of other volatility assets like Vol 25, Vol 25 (1s), Vol 50, Vol 50 (1s), Vol 75, Vol 75 (1s), Vol 100 and Vol 100 (1s).
Like every other synthetic index pair, Volatility 10 and 10 (1s) obeys the forces of supply and demand since they are devoid of fundamental and sentimental interruptions. For that reason, it is easy to analyze the markets using appropriate technicalities.
In trading Volatility pairs, it is always better to understand how to go about it. That is why a trader’s success or failure in the real market situation is majorly influenced by various factors such as his/her trading experience, trading psychology, trading personality and strategy and a good understanding of a trending and ranging market. Among these factors, the following will be discussed to give a clearer understanding since they serve as a foundation for profitable trading….
Table of Contents
How to trade Volatility Indices (Vol 10 and Vol 10 1s)
Don’t be left out, Open a free trading account now by clicking here
1. Understand the current price movement:
Price movement simply involves the price structure of the market. Like in every financial market, price moves in three ways namely; uptrend, downtrend and range.
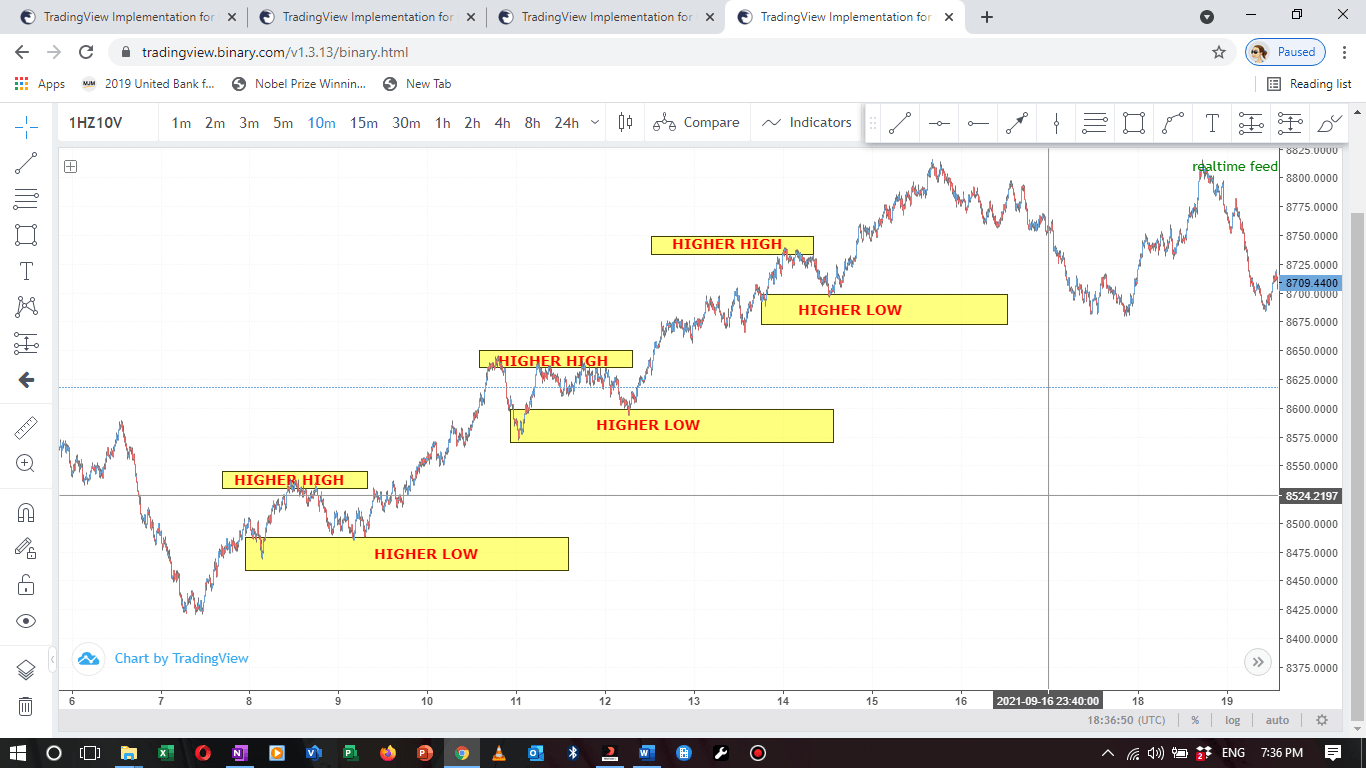
In an uptrend, the price moves in an uptrend, it will make successive higher highs and higher lows. The figure below shows the price structure of an uptrend market in Volatility 10 index. In this type of trend, a trader should seek for buy opportunities which will present itself in different time frames. However, while seeking for buy opportunities, it will be a suicidal adventure to go short or counter trade the trend except when the price is on a corrective move.
Figure 1: A picture showing an uptrend State of Volatility 10 Index
Even so, if price moves in a downtrend, the market will make successive lower highs and lower lows. The figure below shows the price structure of a downtrend market in Volatility 10 (1s) index. In this type of trend, a trader should seek for sell opportunities which will present itself in different time frames. However, while seeking for sell opportunities, it will be a suicidal adventure to go long or counter trade the trend except when the price is on a corrective move.

Figure 2: A picture showing a downtrend movement of Volatility 10 (1s)
Therefore, to trade Volatility 10 and Volatility 10 (1s) indices successfully, the first thing a trader needs to know is the trend of the market. Is the market on an uptrend? then seek for buy opportunities! Is the market on a downtrend? then seek for sell opportunities!
2. Understand when the price is making a pullback:
A pullback is a temporary trend which exists as a corrective move in a trending market. The figure below (FIGURE 3) shows a pullback from the overall trend (FIGURE 4). Pullbacks also called retracement tends to be one of the bends of many traders, especially newbies who do not understand the impulsive moves from corrective moves. In as much as a pullback can last for several days (as seen in figure 3, where the pullbacks lasted for more than two weeks), it does not change the fact that it is a pullback hence if a trader should trade it, such should be done with utmost carefulness as a higher timeframe pullback could be a major trend on a lower time frame. Hence, when traders (newbies) tend to trade higher timeframe pullback (which is usually a trend on a lower timeframe), they tend to forget that a pullback is just a temporary trend which does not last.

Figure 3: A picture showing a pullback from the overall tend of volatility 10 index

Figure 4: A picture showing the overall trend of a volatility index market
3. Understand when the market is trending or ranging:
This is the crux of all trading adventure; knowing when the price is trending and when it is ranging. A trending market makes successive swing highs and lows (as seen in figure 1 and 2) while a ranging market (figure 5) makes price with higher boundary resistance and lower boundary support. Depending on the current trend of the market and the timeframe of preference in which a trader decides to make his analysis, a trader should be able to make appropriate trading decisions using ideas shared in this publication. For instance, Figure 5 shows the picture of Volatility 10 (1s) which is on a range or sideways movement. What a trader should do in this case is either to short the highs and resistance boundaries or to long the lows and support boundaries knowing too well that a higher timeframe range will make a lower timeframe range. However, if an amateur trader is to trade the market, it is always appropriate to avoid the market until a breakout sets.

Figure 5: A picture showing a range or sideways movement of Volatility 10 (1s) Index
I believe that mastering these few points will help any trader to have a good grasp of both volatility indices.
If this publication has been helpful, kindly visit my YouTube channel @juvirtrades and subscribe and subscribe to the channel. Do not forget to share, like and comment on the videos.
For coaching and mentorship, you can reach me at juvirtrades@gmail.com or you can reach me either by call, WhatsApp or telegram through +2348027790183
Disclaimer
Deriv offers complex derivatives, such as options and contracts for difference (“CFDs”). These products may not be suitable for all clients, and trading them puts you at risk. Please make sure that you understand the following risks before trading Deriv products: a) you may lose some or all of the money you invest in the trade, b) if your trade involves currency conversion, exchange rates will affect your profit and loss. You should never trade with borrowed money or with money that you cannot afford to lose.