One of the things I’ve learned from trading Volatility 75 Index is that you must get your entry right, because if not, the draw-down that may come if you pick a wrong trade can affect your equity adversely.
Learn the Secret of Forex Trading, Click here to download a free e-book now
As one of the indices on the Deriv Platform, trading Volatility 75 Index can give you a good return on your investment, and also make you lose your money, so it’s important that you take time to study the market structure before placing any trade. If you don’t understand anything about market structure, read this article : The Complete Guide to Price action trading
As a rule of thumb, you can experiment on Boom and Crash, but not on Volatility 75, because any small move or a small change in price can affect your equity adversely.
Table of Contents
Here are 5 Mistakes you should avoid when Trading Volatility 75
1. Don’t trade if you don’t understand the market structure.
Many traders makes the mistake of entering the market without understanding what is really happening in the market.
You require a certain level of understanding of the market before you can be able to make substantive profit from the market (We will delve into this in details in this article)
2. Don’t be too ambitious at the start
Trading Volatility 75 can change your life but don’t be in a haste. Treat trading as your actual business and you will enjoy the market in the long run. Take it one step at a time; Learn, trade, grow and continue learning.
3. Don’t trade without a Trading Plan
It is important to have an investment guide before you place your first trade. Your guide will outline your trading and risk management strategy. Trading without a plan is a recipe for failure.
4. Picking low probability trades
Many traders make the mistake of picking trades without any analysis with the hope that the trade will give them huge profit.
For instance, they can just jump into V75 buy if they see a little push up without understanding what the market is doing. Don’t be like them, understand what is happening or what will happen in the market before you jump into the market.
5. Not expecting to Lose
Losing is part of trading. No matter how good a business is, every business must lose money in one way or the other. You have to be willing to keep going even when you momentarily loses. Your goal should be to make sure that your profit margin is higher that your lose margin.
How to Trade Volatility 75 Index
There is no special way of trading Volatility 75 Index. The pattern of trading Vol 75 is the same as with currency pairs. Just like currency pairs, the under listed are very important when trading Vol 75:
- Support and Resistance
- Trendlines
- Market Structure
The only difference with currency pairs is that V75 is very volatile; meaning you can make good money within the shortest possible time, if your entries are right.
How I analyze Vol 75 Index
I start analyzing Vol 75 Index from the daily chart. Analyzing from a daily chart helps me understand the market trend. Personally, I normally use the line chart to study the market, then use Candlestick chart to place trade.
Learn the Secret of Forex Trading, Click here to download a free e-book now
When using the line chart I focus on the closing price, which enables me to understand support and resistance. Once you can spot the major and minor support and resistance in the daily, you can have an idea of the market trend, then use lower time-frame to spot a perfect entry position for your trade

Fig 1: Vol 75 Indices Line Chart

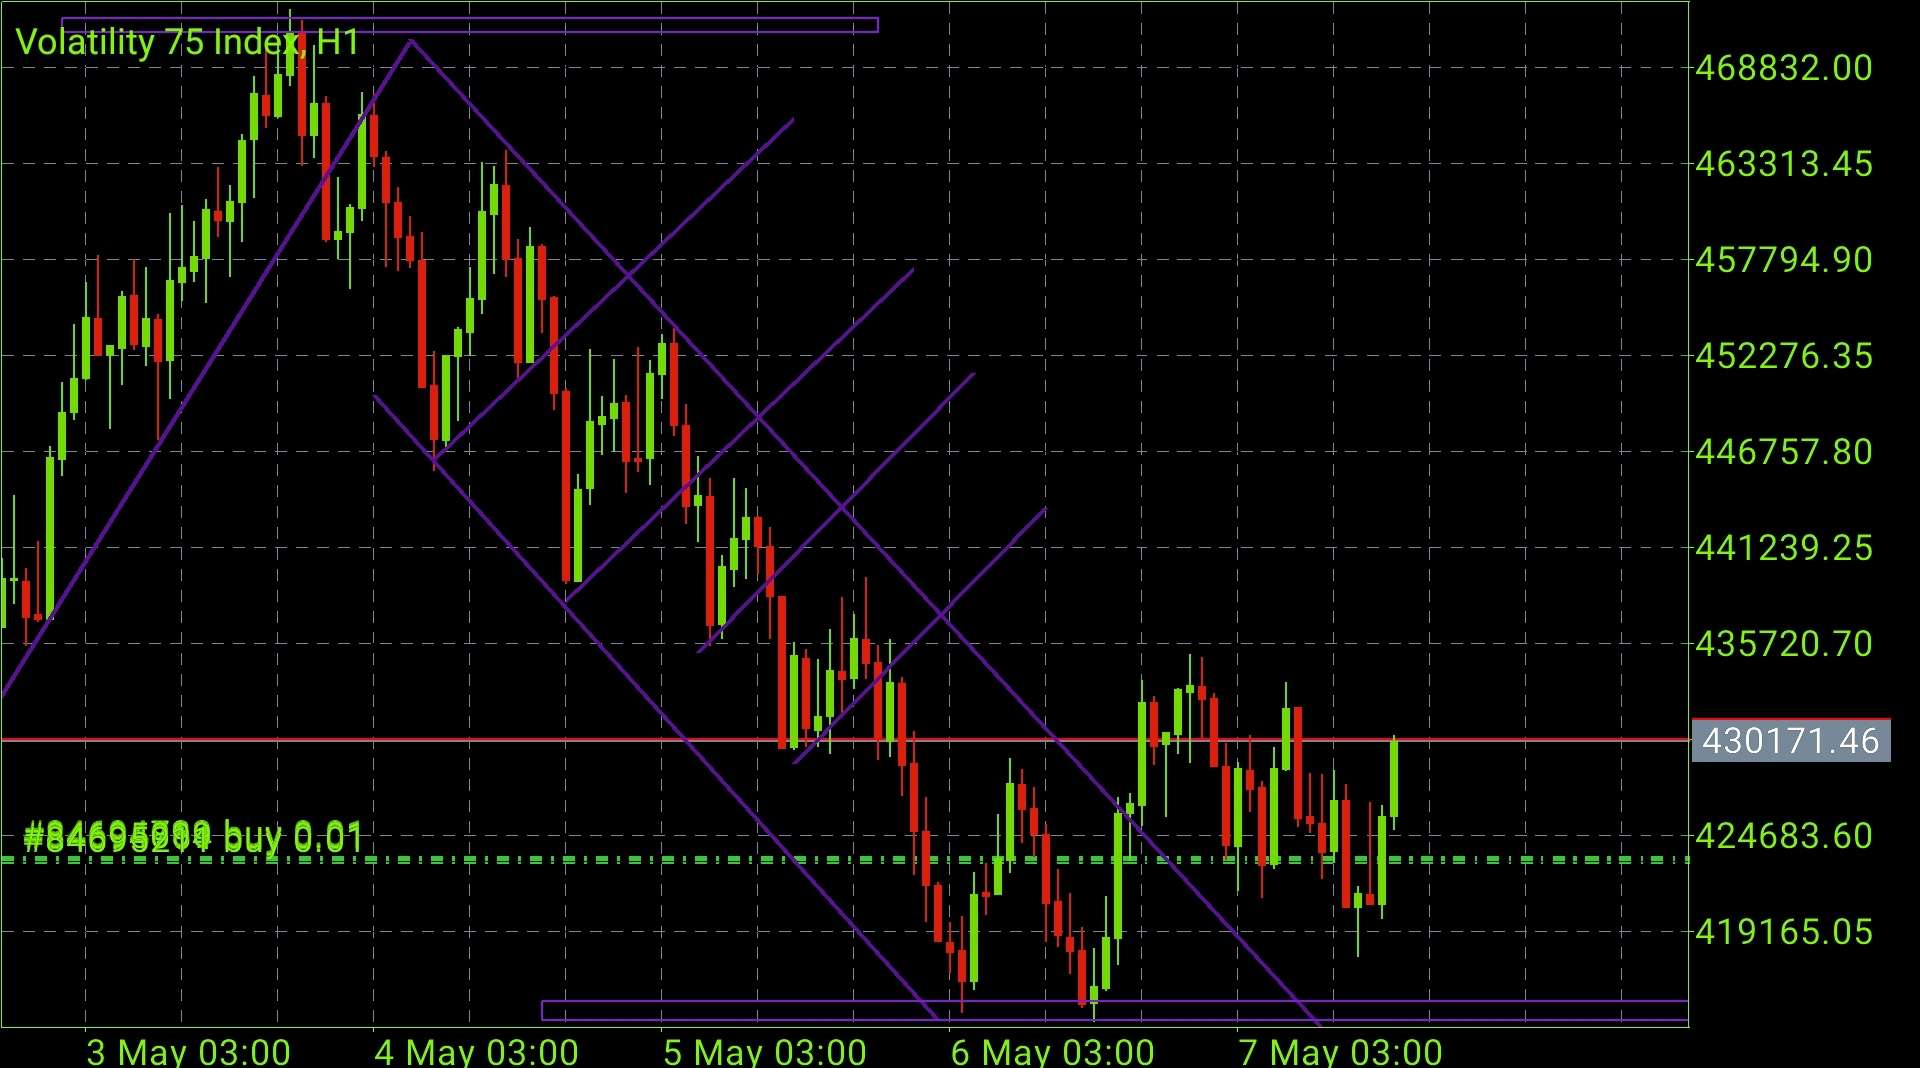
Fig 2: Vol 75 Indices Candle Stick Chart
The Secret To Trading Volatility 75 Index
- Avoid ranging market structure, but if the distance between the support and resistance is big enough, you can trade between the range (that is: buy at support, sell at resistance) or wait for breakout because price can’t stay in horizontal structure forever (read more)
- Look out for the key zones (support and resistance lines) on the daily timeframe and your trading timeframe. The key zones is what will guide you to draw your trendlines.
- Trendlines are fundamental component of trading; learn how to draw trendline.
- Always use proper risk management strategy (I mostly used 0.001 lot size)
- If you don’t know the trend of the market, don’t place any trade
- Volatility moves in a zigzag form, so if you can spot the formation of a ‘W’ of ‘M’ based on the market structure you can make money from the market.
I didn’t make much profit on my first week of trading Vol 75, but I started making crazy profit after 2 weeks of consistency. The only thing I did was that I discovered a strategy, test it on the demo, modified it, then use it on my real account.
When to Sell Volatility 75
The following conditions must be met before you place a sell on V75.
1. It Should be Overbought on the Daily Time frame:
This is very important, once you spot an overbought condition on the daily timeframe or on the 4 hour timeframe, you can go over to M30 or M5 to look for entry point. To get the overbought signal, you can use the settings on the screenshot below: Add Stochastic Indicator, then add alligator to the same indicator window as the stochastic.

Setting for Stochastic

Setting for Alligator Indicator
Your Chart Should look like this after adding the two indicators.

Your sell signal is when the 3 alligator line cross the 80 level of the Stochastic downward. However, this is a risky entry, to get a confirmatory entry, you need the price to bounce off your key zones (resistance zone in this case) on the chart. If it’s happen at a strong resistance zone on the chart, that is a very strong indication for a sell.
Secondly always be on the look out of the formation of the “M” or “W” shape on the chart. V75 mostly obeys this rule. If you look at market structure, you will see some major historical points on the chart. If I see a “M” formation for instance, I always wait for the formation of the ‘V’ within the “M” then sell at the top of the “V” to get the last leg of the “M”
Note: It is important that the conditions above are met, so that you can make good profit and not be scared of loses.
When to buy Volatility 75
It Should be Oversold on the Daily Time frame:
Your buy signal is when the 3 alligator line cross the 20 level of the Stochastic upward. However, this is a risky entry, to get a confirmatory entry, you need the price to bounce off your key zones (support zone in this case) on the chart. If it’s happen at a strong support zone on the chart, that is a very strong indication for a buy.
Things you should know when trading V75
- Beware of stop loss hunt and the liquidity trap in the market; only close your trade in red when you notice a clear violation of the market structure.
- Volatility 75 is a very risky asset, it’s good to always have a clarity of where the market is going to, so do a top-down analysis of the market (look at the previous high and previous low, know the key points on the charts, etc.,) before placing any trade
- Finally, trading Forex is risky, always apply proper risk management
V75 Broker
The best broker for Volatility 75 (V75) is Deriv, you can sign up by clicking here. If you have any questions, or concern, Kindly drop a comment below.
Disclaimer
Deriv offers complex derivatives, such as options and contracts for difference (“CFDs”). These products may not be suitable for all clients, and trading them puts you at risk. Please make sure that you understand the following risks before trading Deriv products: a) you may lose some or all of the money you invest in the trade, b) if your trade involves currency conversion, exchange rates will affect your profit and loss. You should never trade with borrowed money or with money that you cannot afford to lose.
Thanks…so insightful on V 75.
Sir i dont know how to get v 75 chart on my laptop. The mt5 i downloaded from binary platform gave me forex chart.
Help how do i go about it.
Open a demo account on Deriv
Then go to MT5 app and select the Deriv Demo server and use the log in details you use for opening the account. Trade on Demo first before going to real account
I need assistance with Volatility 75 whatsApp number is +22660910446
Don’t join that group.. They charge.. There’s groups that will help for free
Which group that help for free
Kindly share with me the free group link
Like??
Which group sir?
I need that group my WhatsApp number +254741066897
Either way you downloaded it by playstore or from a broker website is okay
Open a synthetic account with deriv.com and you will see it automatically by itself
Login using your deriv account details
that might be case that u need to register with the broker and then make sure u have done the sythetics registration and check the broker on the mt5 and add the server and the password, that should do
Log into your binary (deriv) and tap on usd amount on right top corner of the sight and create synthetic account after that copy your login code and open your mt5 platform add it to your account.
Use Deriv broker
Deriv volatility 75 doesn’t trade 0.01…which broker do you use
Detiv
Hey Warren do you have any class or telegram group?
how do you know the trend of the market
U can used W or M then u wait for test and hit
Dm me at Whatsapp+254114220676 I will teach you top-down analysis
I need assistance with Volatility 75 whatsApp number is +22660910446
Thanks for the insight sir, i am new to trade… and already have burn alot of money away. i need your help in signals notification. i will really appreciate if you can inbox me on how to go about it. Thanks in advance
Hlw sir….can i have your assistance in trading volatility indices….+255658 209560 watsup
Bro thanks for this wonderful information thanks and God bless you sir
Amen
Hello sir please which broker can I use to register volatility 75 ,or does it have is own platform please I need reply sir,
Deriv.com is the only broker that currently offer V75.
Hi Warren, I’m a beginner trader and have lost all my invested savings. Is there anyway you can help train me as i intend to begin trading volatility again.
I also donot understand some of the technicalities you explained, are there any videos?
Thank you
+233244958573
Thanks man. So much information here!. God bless you
Hi man,
I got a question pls. I will be glad if you respond:
The oversold and overbought does not occur everyday on the daily time frame I.e it takes days to occur. So, how can one use it to spot the W and M shapes to trade everyday.
Thanks
spotting M and W Shape try to use 4h timeframe and go down to 1h but mostly you find those two shapes on 15m timeframe
Hi guys.How are you. I recently opened a Deriv demo account but it doesn’t have Volatility 25,75…. Is there another broker with the same Volatility 75 like the one on Deriv. Thank you.
They are only available on Deriv. Open Synthetic index account, if you have any issues email me; nditoeka@gmail.com
what is the use of the aaligator indicator
whatsapp = 0782025165
please send me at what’s app
+91 95747 79000
Thank you
Very Insightful, I was looking to know the difference between VOL 75 and VOL 75 1s
its john ,need some help……..whatsapp number +254792434578
How many times should i pinch the chart so that it gives me correct position of the alligator
I need assistance with Volatility 75 whatsApp number is +27810764303
is there a group i can join