One of the best methods use in identifying Forex market structure is price action trading strategies. In trading with price action, there is no use of indicator, we use the naked chart. In this article we will look at fundamental things you need to know about price action trading strategies and how you can use it to improve your trading. Note: If you want to make sustainable income from trading, your chart must be as simple as possible.
Learn the Secret of Forex Trading, Click here to download a free e-book now
Table of Contents
The Complete Guide to Price Action Trading Strategies
Market Structure
As the name implies, market structure is the historical representation of price movement in the market over a period of time. Market structure gives a trader a general overview of the market and it is one of the basis of which all trading analysis are made. Price action on the other hand is understanding the psychology behind market structure.
Learn the Secret of Forex Trading, Click here to download a free e-book now
There are three possible types of market structures, we have:
- Upward trend
- Downward trend, and
- Range
Upward Trend
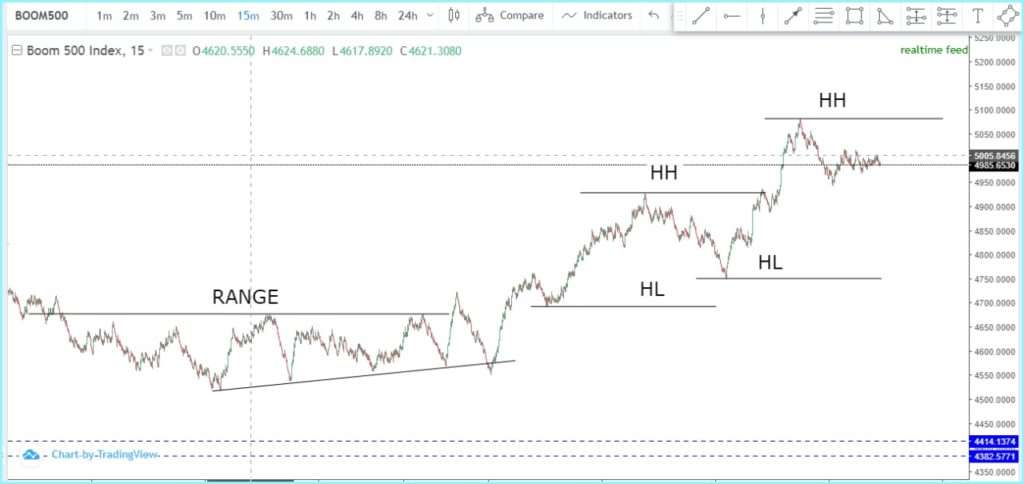
In upward trend, the price is going upward. This is delineated with a series of Higher Low (HL) and Higher High (HH) as indicated on the chart above. In Upward trend we normally look for long positions (buy) until the market structure is broken.
Downward trend
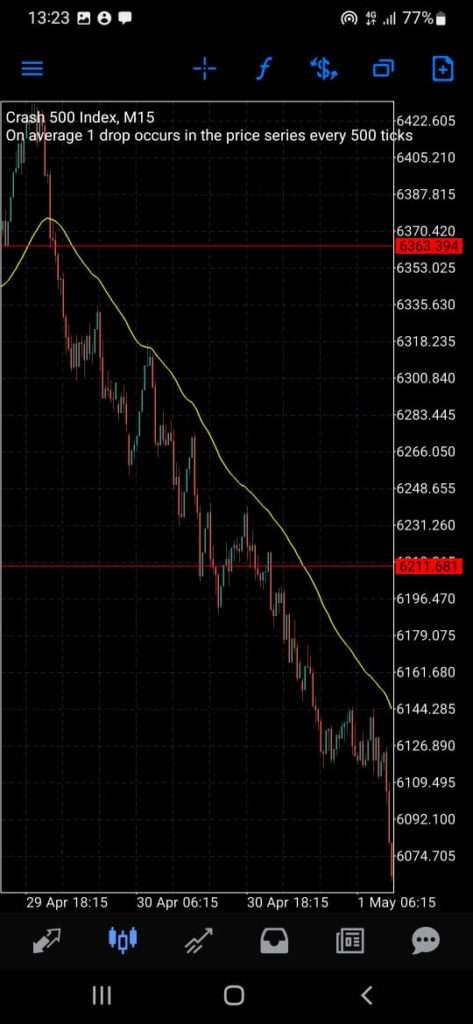
In a downtrend, the price is going downward. This is delineated with a series of Lower High (LH) and Lower Low (LL), in a downtrend, we look for short position (sell) until the market structure is broken.
Range
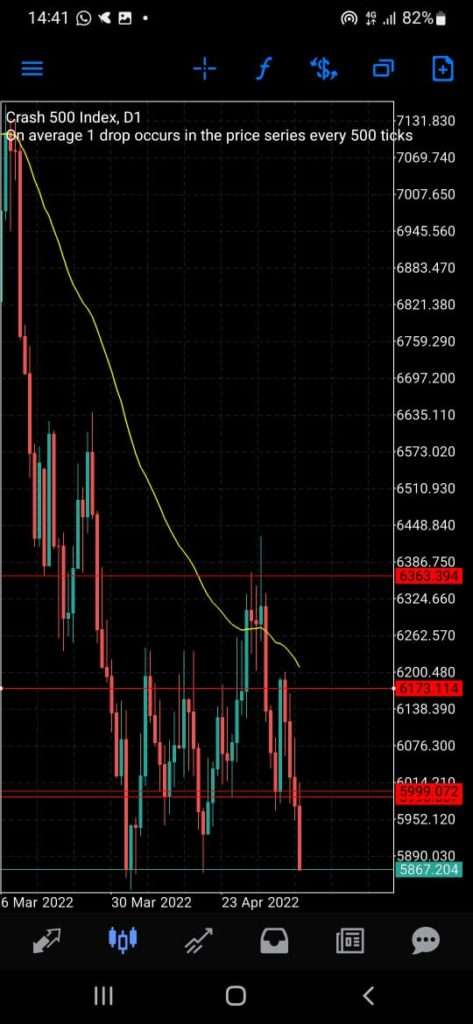
In a range or consolidation market structure, price is moving between two trendlines (Support and resistance), thus providing an horizontal structure. If the distance between the support and resistance is big enough, we can trade between the range (that is: buy at support, sell at resistance) or we wait for breakout because price can’t stay in horizontal structure forever. So in trading a ranging market, we either trade between the two lines (buy at support and sell at resistance) or we wait for breakout.
Trendlines
Trendlines are the fundamental element of price action. It is one of the analysis tool we use in price action trading strategies.
There are two different types of trendlines.
- Support lines
- Resistance lines
Support lines
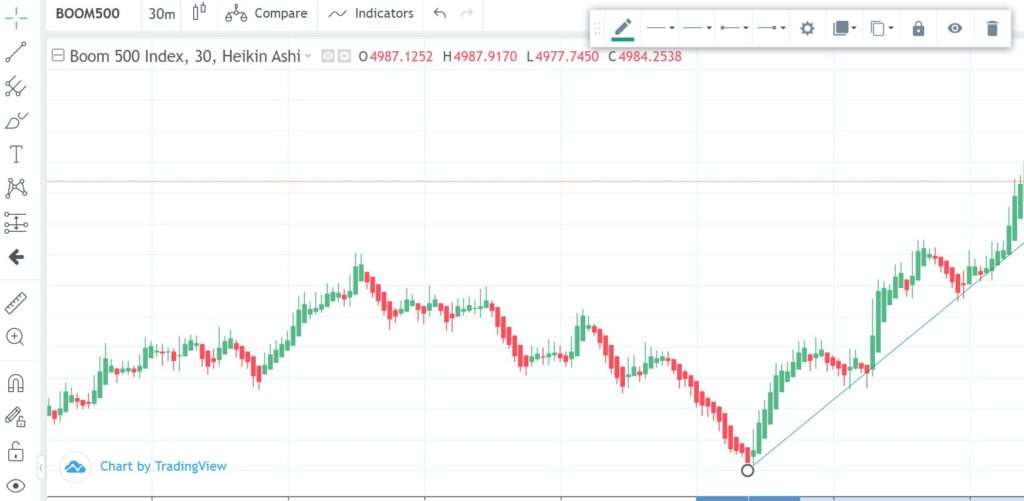
Support line also called ‘the buy spot’ is a trendline connecting at least 3 points in the chart where price bounce up from historical price movement. Support line act as a float, once price reach there, it bounce back up. But price can also break support line based on many market forces; like Volume, liquidity gap and market orders. Thus, support line can turn into a resistance line and vice versa.
Support line is:
- Used for Uptrend Market Structure
- It should connect Major points in the bottom (LL)
- Price has a tendency to jump above the support lines
Resistance Lines
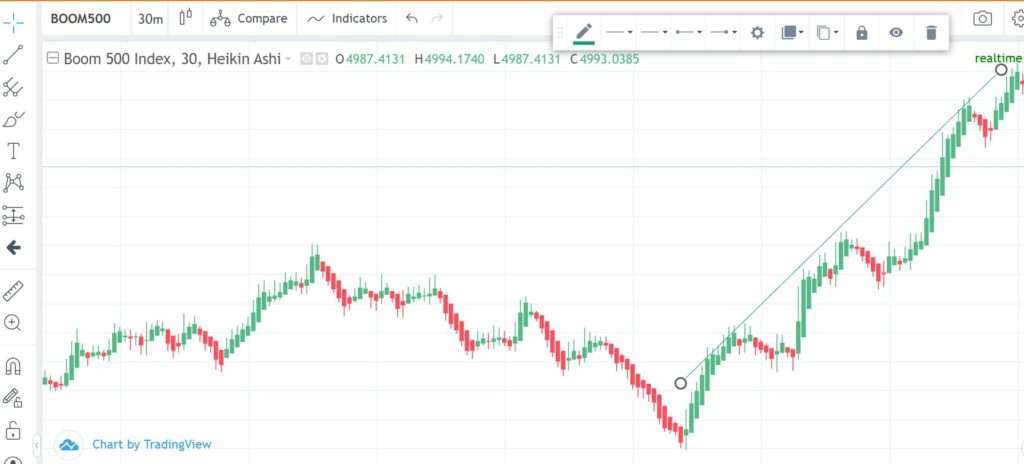
Resistance Line also called ‘the sell spot’ is a trendline connecting at least 3 points in the chart where price drop down from historical price movement. Resistance line act as a ceiling, once price reaches there, it bounce back down.
The Resistance Line is:
- Used in Downtrend market structure
- It should connect major peaks at HH
- Price has a tendency to drop below the resistance lines.
How to Draw Trendline.
Different traders can draw different trendline in the same chart. There is no wrong or right way of drawing trendlines. In a ranging market, for instance, trendlines can be drawn as horizontal lines to mark the support and the resistance zone so that if you want to trade between the zone you monitor and enter only at the lines or wait for breakout if you are a breakout trader.
To be sure its a trendline, there should be at least 3 touches.
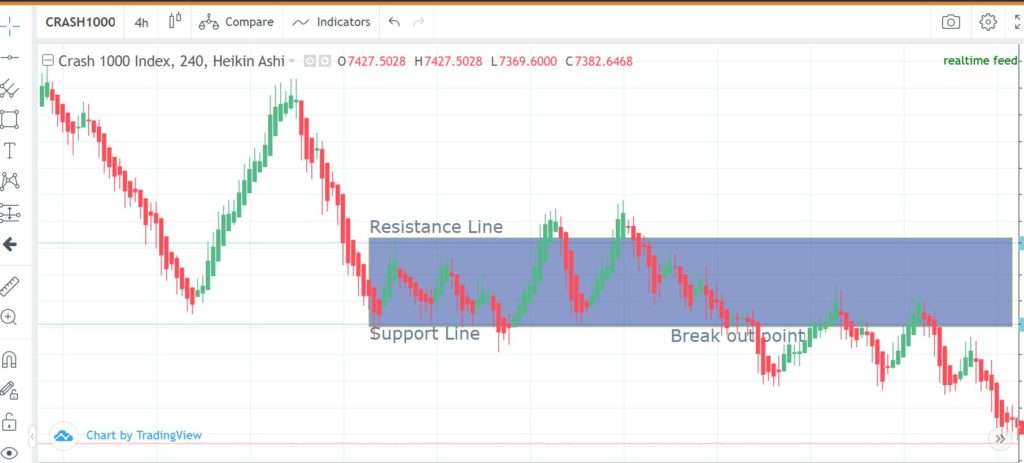
From the above chart, the shaded area is the ranging market, you can spot the resistance line, the support line and the breakout point. In trading a ranging market, if you want to go long (buy), enter at the support line and go out close to the resistance line. If you want to go short (sell), enter at the resistance line and close before the support line.
Fibonacci Retracement
Another important fundamental of price action trading is Fibonacci retracement; though this is an advance technique; but if you know how to draw Fibonacci retracement line, it can help you in spotting some good trade entries.
The rule is simple, if there is an intersection between trendline and Fibonacci retracement, then it is a big sign of a retracement.
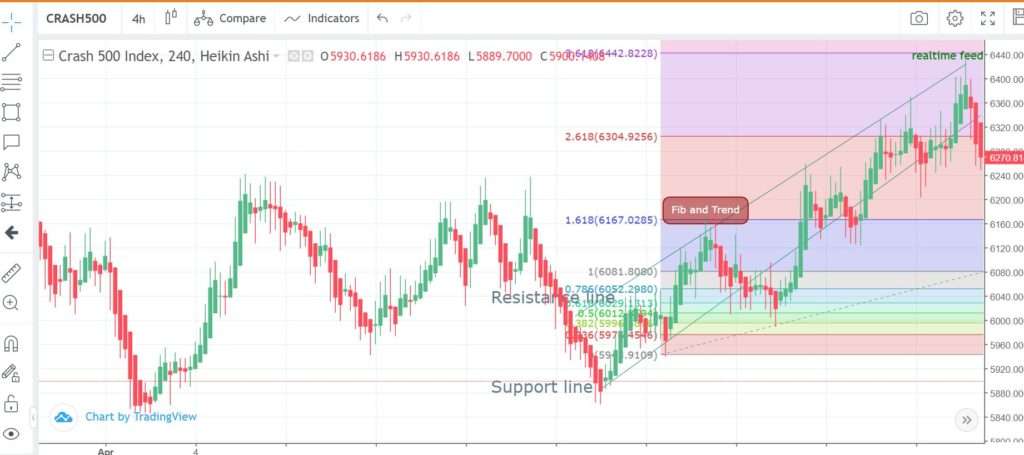
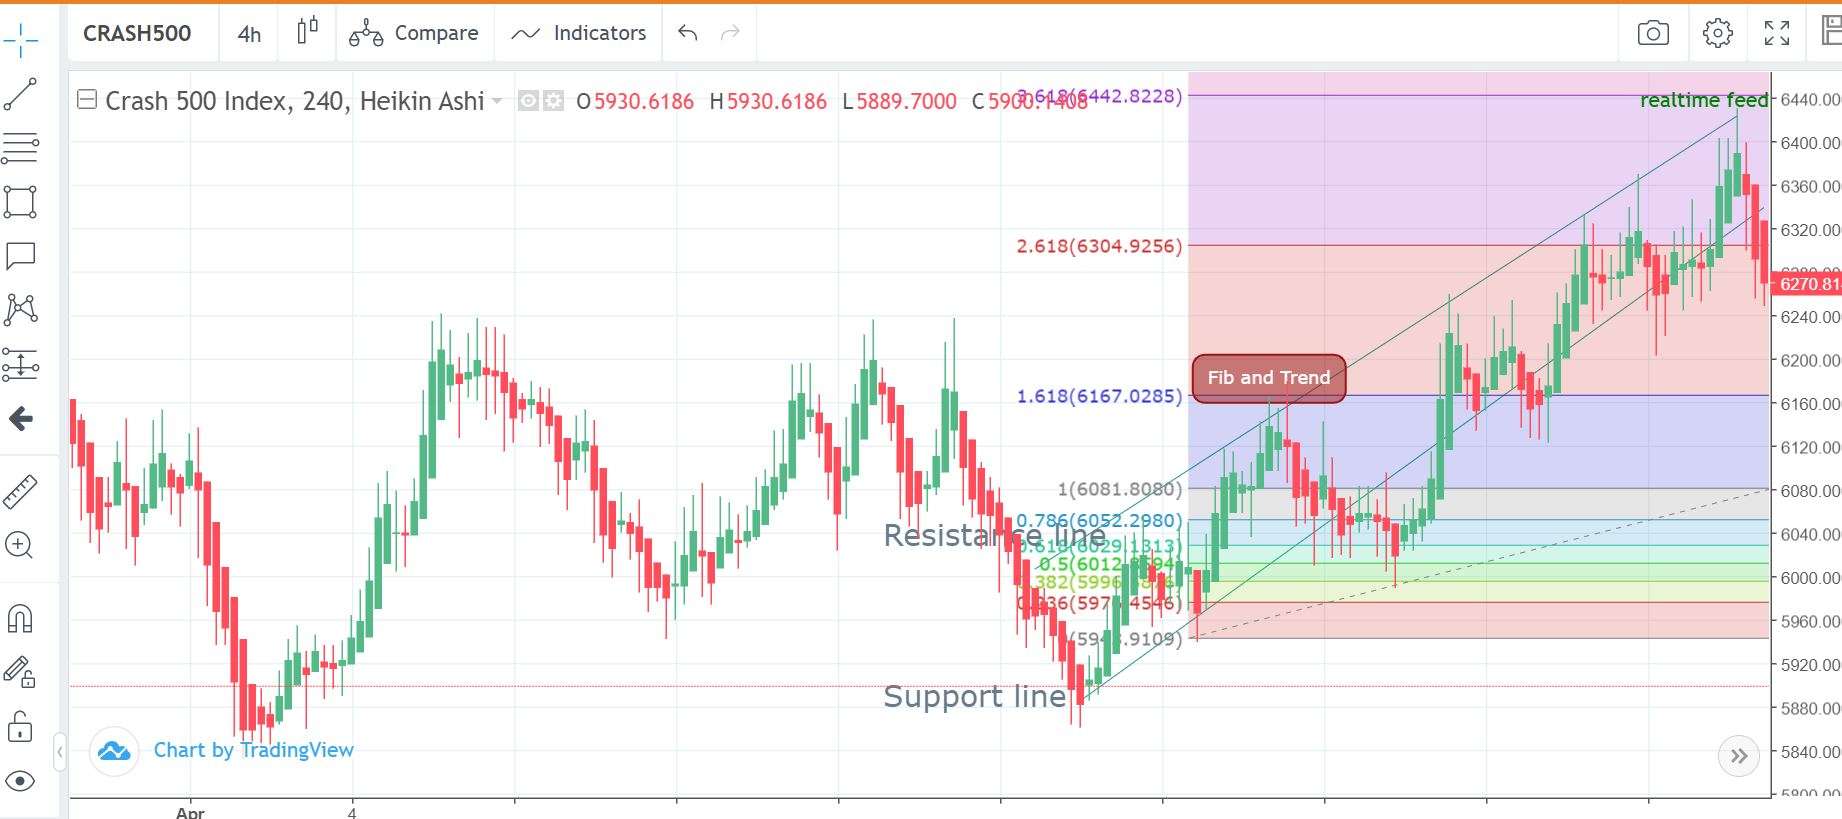
From the chart above, if you notice as soon as the Fibonacci line intersect the trendline, there was a sell immediately after that. Fibonacci trendline intersection has been a powerful tool used by many price action traders as a confirmation of trades entry in the market.
Steps in taking live trades using Price action trading strategies
- Find the Market trend
- Find key critical areas in the chart (support and resistance line)
- Draw your trendlines
- Find your stop loss and take profit level
- Wait for price to reach your support line or resistance line, then watch price reaction at the trendline before placing any trade.
Final Thoughts
Most times, current price can be very far away from the trendline. In such scenarios, wait until the price gets to the trendline, then monitor the reaction before placing any trade. Picking trades on your trendlines will increase your win rate with over 90%. Please note, stop loss level are very point, always place your stop loss at least some pips away from your trendlines. Trading without stop loss is not a good trading habit. Finally, don’t fret when you lose a trade, find out why you lose and adjust your strategy to cover the lapses.

Very knowledgeable and an asset to us who are still learning.
Thank you sir
Well explained in a lay man language, indeed tight.
Thanks for the useful fx trading information that you shared for free. God bless you.
The information is very useful. Thank you for that. I am a newbie in the B&C market I would love to have some insightful tips from you please. Thanks.
Here’s my WhatsApp number
+2348034500391
Very insightful and well explained..thanks so much…more Blessings on u sir..,pls sir am new In this and i have an issue I will like to discuss with u sir..my whatsapp contacts sir..+2347044310987..
Thanks
Thanks , very informative.
I appreciate ur work sir, this is my WhatsApp +234,7068078684 and I like to discuss some of my point to u sir.
I’m delighted to have such kind of information on trade, thanks alot. Kindly share some more knowlage and guide please, +254711180774
VERY ASSETFUL INFORMATION .MUCH BLESSINGS
Well explained thank you much much.
Very useful information sir.God bless you.
Well explained and teachable content.Thanks.