The name ‘Quasimodo’ is traced to Victor Hugo’s Quasimodo, a game character that is distinct for its hunch-back. The hunch-back of the Quasimodo served as a peculiar feature of the character as compared to other characters in the game. In trading, the Quasimodo hunch-back can be likened to successive swing highs and lows of a market trend. This trading pattern utilize price action, trendlines, key support and resistance levels to predict the market movement. This characteristic feature is what makes the Quasimodo Trading strategy unique from other price action trading strategies.

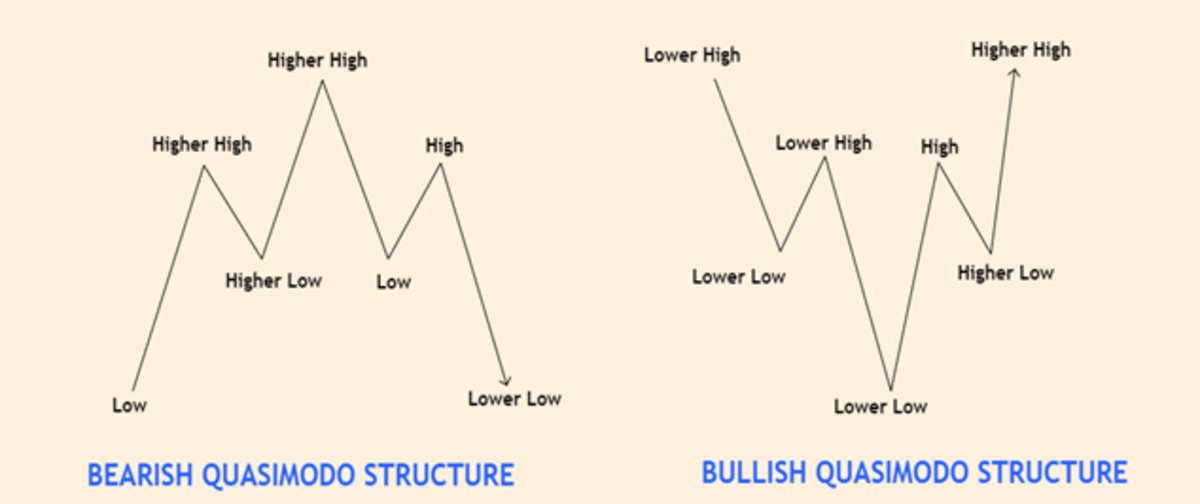
Picture 1: Bearish and Bullish Quasimodo Structures
In the discourse where John F. Carter describes the Quasimodo in his book titled, ‘Mastering the Trade’, the hunchback is depicted by three peak formations (similar to a head and shoulder and an inverted head and shoulder). These peak formations serve as the foundational points of interest where basic elements that define the strategy can be observed.
The formation of these peak zones follows through phases of price movement where the price moves and creates successive highs and lows. However, due to forces of demand and supply, price tends to alter its movement, thus, creating failed swings and structural highs and lows that depict the establishment of a new trend. For instance, an uptrend is defined by succeeding higher highs and higher lows. Over time when the forces of demand and supply set in, uptrend highs and lows will no longer be created. Rather, the price will rally around an established peak and make a failed swing. This failed swing leads to the emergence of a new trend (downtrend) which is characterized by the creation of lower highs and lows.
The Quasimodo Trading Strategy
The Quasimodo trading strategy is a price trading pattern which is regarded as one of the most profitable trading strategies for day traders. It capitalizes on short-term market trends and is a good technique for detecting trend reversals pattern due to the characteristic formation it creates when an emerging trend that harmonizes with support and resistance levels is about to begin.
In Quasimodo’s trading strategy, the establishment of a new trend makes room for a trader to simulate the hunchback using the last three established swings as the Quasimodo structure. With the established swing points, definite elements of the strategy such as specific candlestick formations can be observed and capitalized for profit-making. In addition, these zones tend to serve as zones of established support and resistance that can be used as frameworks for the analysis of price movements by momentum traders.

Picture 2: Bullish Quasimodo Structure showing a change in Trend
For instance, in price action trading, different measures have been established to know when a trend is getting exhausted. Measures like rejection candlestick patterns, failed swings, and changes in candlestick formations and character have been noted which are very vital in understanding price reversal pattern. However, in Quasimodo trading, three major factors are used namely; the failed swing, the establishment of an M and W pattern and the creation of rejection candlesticks at peak zones of higher time frames. and the inverted head and shoulder pattern. The failed swing portrays signs of chart patterns such as the W and M chart pattern the head and shoulder.

Picture 3: Bearish Quasimodo Structure showing a change of Trend
Before the emergence of a new trend, the Quasimodo pattern signifies trend exhaustion through a series of candlestick formations. This trend of exhaustion can be identified using tactics such as failed swings (as observed where the market changed in price structure to form new price structures). There, the uptrend price was exhausted after getting to a peak point (HH) and could not continue making subsequent higher highs and higher lows (Picture 2). This was followed by a fall in price and subsequent creation of lower highs and lower lows (LH and LL). Conversely, in a downtrend, the selling price usually gets exhausted after getting to a peak (LL) and cannot continue creating subsequent lower highs and lows. This will be followed by a rise in price and a creation of higher highs and lows.
The emergence of a new trend is always signified by an accumulation pressure which may or may not have a high price volatility. In practical analysis, this leads to the creation of new swing highs and lows (depending on the new trend that has been formed).
Quasimodo Entries and Exits
Using the Quasimodo strategy to spot entries and exits demands a high-level mastery of candlestick anatomy and trading algorithm. This is because, with a good knowledge of candlestick open and close, a trader can easily spot positions for good entries and exits. For instance, the Quasimodo strategy thrives with a good risk-to-reward ratio by leveraging an order block candle that is formed during the emergence of a new trend.

Picture 4: Quasimodo Order Block Candles with its Sell Entry zones

Picture 5: Quasimodo Order Block Candles with its Buy Entry zones
This candle (which may produce a fair value gap in some instances) serves as a good point of interest where trades should be taken. In an uptrend, the close of the order block candle (bearish candle) can be used as a stop loss point while the open can be used as a good entry point. In this scenario, long positions are taken immediately after the price moves above the Quasimodo candle. Conversely, in a downtrend, the close of the order block candle (bullish candle) can be used for entry while the open can be used as the stop loss point. Short positions are taken immediately after the price goes below the bullish order block candle. In both scenarios, price targets are usually placed at preceding swing highs and lows which serve as potential price reversal zones.
If this publication has been helpful to you and you desire to know more about what it takes to be successful in trading, kindly do the following.
- Signup on my YouTube channel at https://www.youtube.com/c/juvirtrades
- Join my free WhatsApp group https://chat.whatsapp.com/HJ2Lz96W378BJVfsQ5nU2F
- Contact me through a direct call on +2348027790183.
Risk Disclaimer
Deriv offers complex derivatives, such as options and contracts for difference (“CFDs”). These products may not be suitable for all clients, and trading them puts you at risk. Please make sure that you understand the following risks before trading Deriv products: a) you may lose some or all of the money you invest in the trade, b) if your trade involves currency conversion, exchange rates will affect your profit and loss. You should never trade with borrowed money or with money that you cannot afford to lose.