One of the most defining characteristics of Deriv is the periodic addition of new assets in their collections. Every synthetic index trader knows that it is a regular occurrence for them to receive a new email from Deriv, intimating them of new assets or features on the market. This has gone so steadily that over the years, Deriv has ensured that their clients have ample samples of different trading assets ranging from Volatility series to Step series to Boom and Crash Series, Jump Series, Basket indices and Volumes over Boom and Crash. This is so because, the more the variety of assets, the better it is to have choices per time. In this article we will look at Crash 600 and Crash 900.
Don’t be left out, Learn how to trade forex the right way, Click here to get started
Prior to my last article on synthetic indices, Deriv had only 25 Derived trading assets. This was in the early months of 2024. However, as of today in January, 2025, they are more than 40 Derived assets in all. While this is a good feat in terms of market expansion and capitalization, I feel that Deriv aims to provide their clients with numerous opportunities through these assets. More so, it could also be a way of retaining their existing client base while keeping them busy or glued to the variety of markets that operates 24/7.
Of the numerous newly introduced assets is the Crash 600 and 900 assets. Before this time, the Crash series began with the 1000 index, followed by the 500 and 300. However, few months ago, Deriv introduced the Crash 600 and Crash 900 assets as an accompanying trading instrument in the Boom and Crash indices. Although their mode of operation follows suit like those of the other Crash series, they tend to differ in numerous aspects of trading.
Since this article is tailored to help beginners find their feet in the trading game, let us examine how you can successfully trade the Crash 600 and Crash 900 pairs profitably.
Table of Contents
Understanding Crash 600 and Crash 900
The Crash 600 and 900 are a unique set of trading instruments because, they are they new in terms of market history and charts, but they are quite similar to other Crash markets. – Crash 300, Crash 500 and Crash 1000. The following are some of the valuable lessons which will be addressed in terms of similarity to other markets and their unique stature.
The Uniqueness of Crash 600 and 900 Assets
Crash 600 and 900 are unique in the sense that their trading or chart history dates back to a very short time. And this could influence the type of trading decision that anybody including beginners should take note (Picture 1) thus:


- Following the pictures above (Picture 1 and 2), it will be obvious that both pairs are just 21 weeks old or 5 months Old. The implication here is that, since the market has a very short history to fall back on, so trading exercises should also be limited to Day Trading and Scalping opportunities.
- Day trading and scalping will be the most rewarding way to trade these instruments because with the little history, traders can rely on potential zones of interest which will fall in between the Daily to Hourly timeframes.
The Similarity with other Crash Markets
Crash 600 and 900 are similar to other crash markets. As such they possess similar qualities and attributes. These includes the following.
- They are designed to simulate market crashes (massive drops in price) at random intervals, with the numbers 600 and 900 representing different volatility levels and price movement characteristics.
- Both indices have a default trading lot of two mini – lots (0.2),and operates 24/7 even on weekends and holidays throughout the year due to their algorithm-based nature
- Given their synthetic nature, these indices are not affected by real-world economic events, such as natural disasters, geopolitical events etc. This makes them purely technical trading instruments.
- The price movement of these assets are determined by cryptographic random number generation rather than real-world market activity. For that reason, they can operate independently of conventional market hours. This feature is particularly advantageous for traders in different time zones or those who prefer trading during off-peak hours.
Difference between Crash 600 and Crash 900
- Crash 600 typically exhibits more moderate price movements and crash frequencies, making it suitable for traders who prefer a balanced risk profile. The price movement in C600 tends to maintain a steadier upward trend before experiencing sudden downward spikes, allowing traders to implement strategies based on trend following and crash anticipation. In contrast, Crash 900 features more aggressive price movements and potentially higher crash frequencies. This higher volatility profile can offer larger profit opportunities but comes with increased risk.
Trading Strategies for Crash 600 and Crash 900
Some of the profitable strategies that can be used for Boom and Crash trading includes:
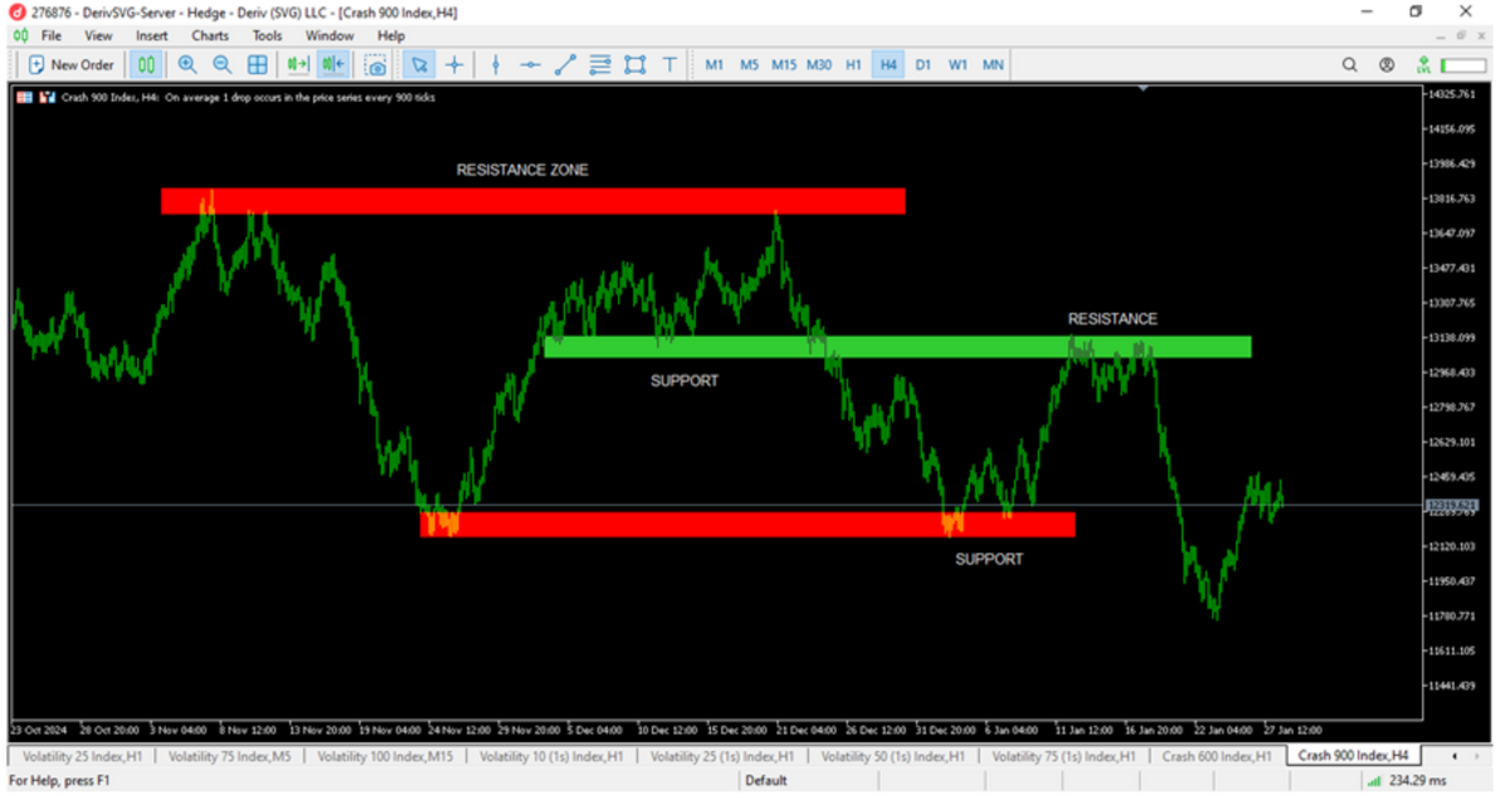
Support and Resistance Trading Strategy
This strategy involves identifying key price levels – areas where the market tends to either pause or reverse. When the market pauses, it creates a zone which can serve as the floor or roof of the market. Usually, this key level act as an important zone of interest.
A support acts as the floor of the market and it is that zone or an area in a chart where the market dynamics shift from a selling pressure to a buying momentum. It is created when price repeatedly reverses from selling to buying at a particular price zone because, in a support, market participants such as institutional investors, retail traders, and algorithmic trading systems collectively recognize this zone as an entry point for a buy. Conversely, a resistance zone acts as the roof of the market. It is also created when price has repeated pause or reversed in a particular price level or area such that, in that zone, market participants use it as an entry point for a sell.
As a new beginner, one of the important techniques for identifying support and resistance is by using horizontal lines or bars. A typical guide is in the picture below (Picture 3). Once these zones are marked out, it serves as a potential zone of reversal for either buy or sell entries.

Trend trading
A trend is simply the directional flow of the market either to the up or downside. When price trends to the upside, it is called an uptrend. More so, when it trends to the downside, it is called a downtrend.
In a trend, market participants make money easily. Conversely, people tend to lose money more often when the price ranges or consolidates. What this implies is that, traders tend to find better trading opportunities in the market when it trends than when it ranges. Hence, as a new trader, one of the most important skills to develop is to know when the price its trend and when it does not.

Identifying trend possibilities takes place when a trader can leverage the structural formations of price (higher highs and higher lows in an uptrend and lower high and lower lows in a downtrend). Once these structures are formed, a trader should leverage on them until there are potential signals for a change of structure as seen in the pictures below (Pictures 5 and 6).
Understanding the structural formations of price is very easy. To do this, kindly mark out peculiar zones that price has either paused or reversed (Kindly refer to Picture 5 and 6 in this article). These zones differ according to the price trend hence, in an uptrend, the zones are labelled as higher highs and lows while in a downtrend, the zones are labelled as lower highs and lows.
These zones present the price formation structures that traders leverage on for either buy or sell opportunities such that in an uptrend when higher highs and lows are made, buy opportunities are sought for. Also, in a downtrend where lower highs and lows are made, sell opportunities are sought for.

