Are you interested in a simple trading strategy using candlesticks? This beginner-friendly demonstration will help you recognize candlestick patterns and formations that provide good entry positions.
Table of Contents
Top candlestick patterns every trader should know
Candlestick patterns are an essential tool of technical trading. Understanding these formations helps traders make more informed decisions. A candlestick pattern shows the open, close, High, and low of the price of an asset over time. A candlestick has three main features, the body, the wick, and the color. The body represents the open and the close of the price, while the wick represents the intra-day high and low. The color shows the market direction where a green or white candlestick shows a price increase while a red one shows a price decrease.
Read next on chart patterns every trader should know
Traders often need to interpret Candlesticks very quickly, and they should be used with other tools of technical analysis.
There are either reversal candlestick patterns or continuation candlestick patterns. Reversal candlestick patterns show that the market’s short-term direction is about to get reversed. A continuation pattern shows that the market is likely to continue in the same direction. A reversal pattern indicates that the traders can no longer push the market in a certain direction; therefore, the price starts moving in the opposite direction.
Don’t be left out, Open a free trading account now by clicking here
Candlestick reversal patterns
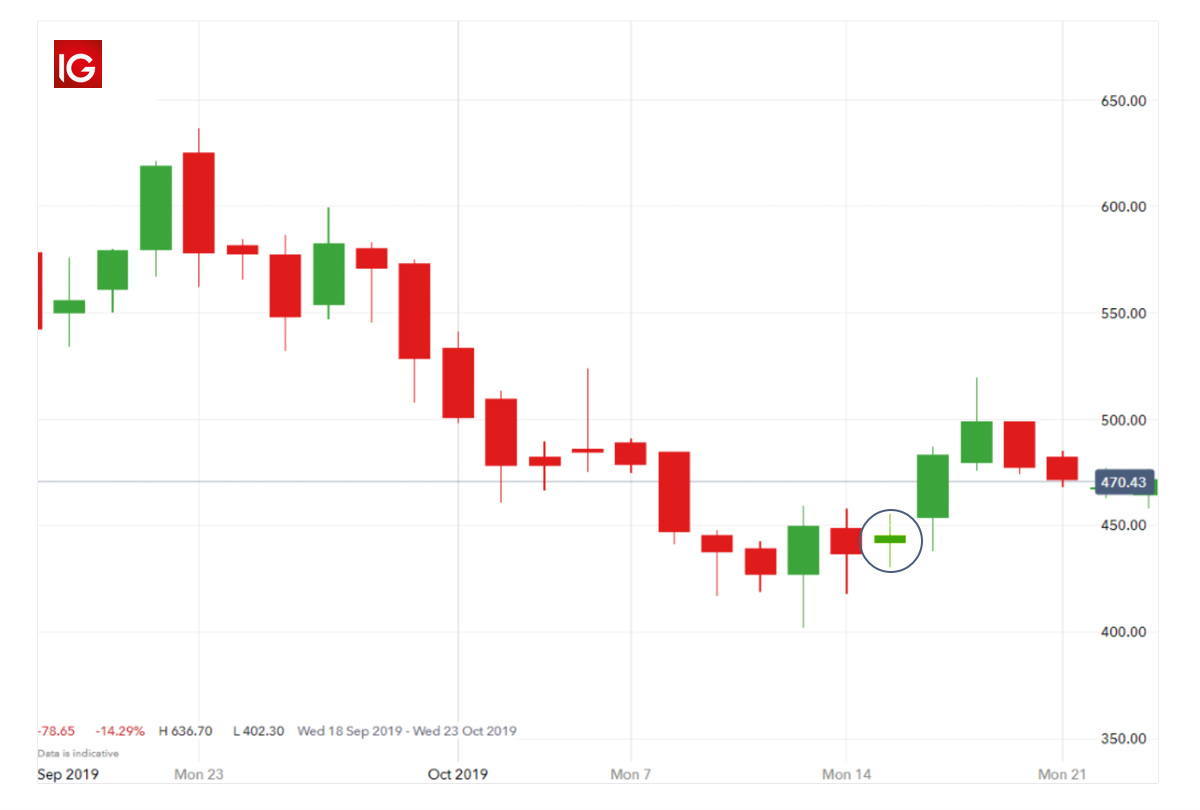
- The hammer
The hammer, also known as the pin is one of the most popular candlestick reversal patterns. It looks like a hammer. When the hammer pattern forms in a bearish trend, it indicates that the market is likely to reverse. When it appears in an upward trend, it is called the shooting star, and it indicates price reversal. A shooting star occurs in a downtrend, and it is an inverted hammer. The elongated tail is usually on the upper side of the body which shows that bulls were unable to push the prices higher.

The elongated tail identifies hammers. The extended tail shows that bears were trying to push the price down, but the price comes back up when they attempt to take prices lower is rejected. This price drop is followed by a strong move upwards, which takes the price back near or above the opening price, forming a harmer.
When a hammer forms, it shows that prices cannot go any lower than the end of the elongated tail. It is also a confirmation of trend reversal.
Trading strategy: put an entry position at market open after the hammer candlestick has closed. Place stop loss at the end of the tail. Set take profit at risk: reward ratio of 2:1.
- Bullish engulfing candlestick
This is a reversal candlestick pattern. A bullish engulfing candlestick forms when the body of an up candlestick (in instances where the close is higher than the open) completely engulfs the body of the previous down candlestick.

The bullish engulfing candlestick indicates a price reversal; therefore, the price does not go lower than the lowest point of the second bullish candlestick.
Trading strategy: set an entry position at market open after the second engulfing candle has closed. Set stop-loss below the low of the second engulfing candlestick. Take a risk: reward ratio of 2:1.
- Bearish engulfing candlestick
This engulfing candlestick occurs in an uptrend, and it occurs when a bearish candlestick completely engulfs the previous up candlestick.
- Doji candlestick pattern
The Doji candlestick is formed when the opening and closing price of a candlestick is the same; therefore this candlestick does not have a body, only two long wicks on either side. Doji shows indecision in the market. The price tries to get higher or lower, but it ends up where it began.

The Doji candlestick pattern is considered a reversal pattern since it indicates imminent change, although not as strong as the hammer or engulfing candlesticks.
If a Doji pattern occurs at the end of an over-stretched trend, it indicates that a reversal is close. If it happens near the beginning of a strong trend, it presents a second chance to enter a trade in the current direction.
Trading strategy: buy stop order above the high of the Doji or sell stop order under the low of the Doji. Place a stop loss on the opposite side of the Doji to where you set your entry order. Set a risk: reward ratio of 2:1.
Candlestick continuation patterns
- Rising three methods/ falling three methods
This candlestick formation is formed when one large body candle forms, followed by three smaller candles in the opposite direction of the first long candle. The three consecutive small-bodied candlesticks form above the low and below the high of the initial candlestick. The third candle then forms the matching direction of the first candle. The third candlestick closes above the high and close of the first candlestick. This candlestick formation shows that buyers are gaining control of the market again, even if there is some selling pressure.

This is a rare candle formation; however, it tends to have higher success rates. Traders can use the pattern to put in long trading positions.
Trading strategy: traders can put an entry position at the close of the final bar. Alternatively, you could enter a trade when the price moves above the high of the final candle. Since its a continuation pattern, your position will be favored by the market trend. Aggressive traders may opt to enter a trade before the final bar closes, but they set a stop loss in case the fifth candle does not form.
- Gaps
Gaps are a popular tool for short-term trading. A bullish gap occurs when the open of the second candle is higher than the close of the first candle and the low of the second candle doesn’t touch the close of the first candle. A gap usually forms at the start of a new trading session because buyers outnumbered sellers when the market was closed.
A gap shows that there was little or no trading in between, and the currency price moved sharply up or down. Continuation gaps, also known as runaway gaps, occur in the middle of a trend and indicate that the buyers or sellers are rushing to trade in a specific direction. These continuation gaps present a good opportunity to join a trend. However, avoid gaps with high volume, as they may be an exhaustion gap, meaning the market is set to reverse.
Trading strategy: in a bullish gap, set your stop loss at the lowest point of the gap and buy on close of the gap. The magnitude of the upward trend will help you decide where to place the take profit.
- Three white soldiers/ three black crows
These candlesticks forms as three long-bodied candles in a row often have short wicks. The three white soldiers form a stair-like formation as the price increases. The three white soldiers are bullish patterns while the three black crows are a bearish pattern.
To spot the three white soldier patterns, find three consecutive green or white candlesticks, each opening and closing a bit higher than the first.

The three white soldiers are a bullish pattern that forms at the bottom of a downtrend. The candles are green in color. The appearance of these candle formations shows that the trend has strong momentum in a certain direction. Traders believe that the increase of the buying pressure is likely to push the prices even higher, therefore enter a trade in the current price direction and set the stop loss at the low of the first white soldier. The three black crows occur at the top of an uptrend, signaling that the market is reversed and prices will continue in a downtrend.