What is forex Technical Analysis? how can you use it to improve your trading. In this article, we will be looking at the introduction to forex technical analysis.
Learn the Secret of Forex Trading, Click here to download a free e-book now
Table of Contents
Introduction
The journey to perfecting oneself in trading, analytical skills, trade management, trading psychology and trading targets makes one trader distinct from another. This comes in to bear that understanding the financial market is one of the many-sided adventures in the world of finance. In any adventure of interest, the ability to know and interpret the patterns, behavior and peculiar characteristics of whatever he/she holds an untold secret to succeeding. Conversely, understanding the financial market lies upon one’s discretion to know and interpret the patterns, behavior and peculiar characteristics of any market price.
Although so many traders believe that understanding financial market trading is a nearly impossible task due to the required time, efforts, trainings and long periods of study needed to attain a proficiency level of knowledge; the use of certain parameters and interpretive tools have made the journey an easy and worthy exercise for anyone to embark on.
Among the numerous methodologies used in understanding the financial market, technical analysis seems to be the most famous and generally acceptable technique of analysis commonly known among traders. Other trading techniques used by traders include the fundamental and sentimental analysis.
What is technical analysis?
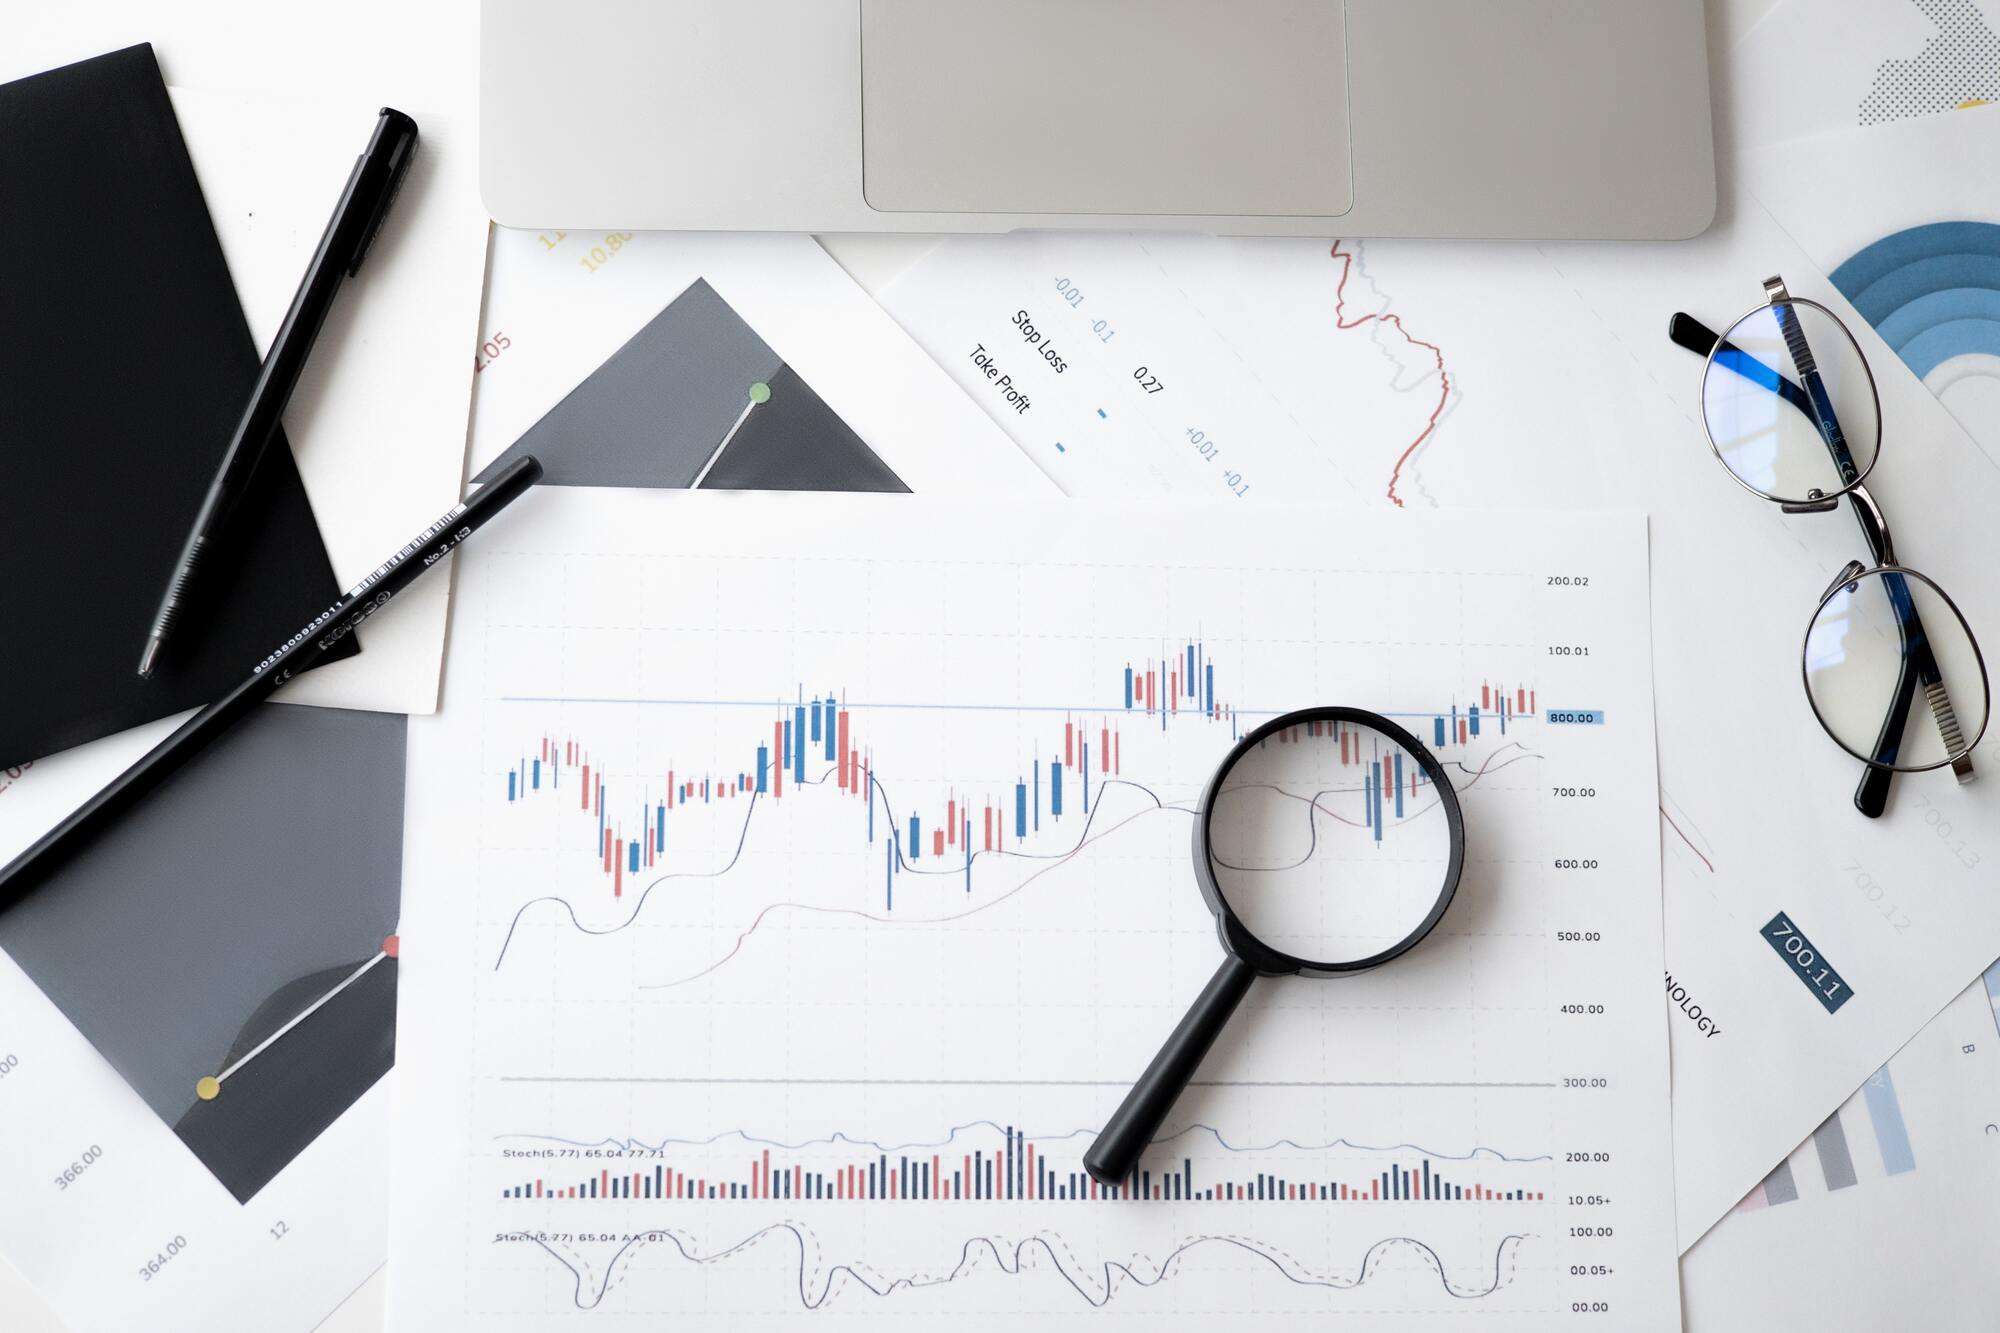
Technical analysis is the commonest used method of analyzing financial markets. It is a means of forecasting future price movement using historical references such as previous data, previous price behavior as seen in chart patterns, price patterns and volume, candlestick structures, shapes and sizes.
The word technical analysis is synonymous with techniques or methods of analysis. It implies using different techniques to achieve an aim. On the other hand, analysis means a detailed examination carried out to understand an issue. Analysis is synonymous with one’s capacity to explain or breakdown a concept. Hence, technical analysis involves the ability to explain and break down price behavior through the use of different techniques or methods.
Traders tend to trust technical analysis much more than other forms of analysis since results obtained through its methods have proven to be consistent over time. Since technical analysis relies upon previous history of price, it leaves the notion that how price behaved yesterday will most likely be how it will behave today and tomorrow. For that reason, the result obtained yesterday by reason of its behaviour will most likely be the same that will be obtained tomorrow and the near future if behavioural features remain almost the same over time.
Since the end result of every trading activity is to make profit, the aim of technical analysis is to help traders make or maximize profit using peculiar methods or techniques.
Top technical analysis tools used by traders
Every trader is known to be peculiar in how they go about their trading adventure. That is why each trader depends upon different technical tools when carrying out analysis. Some of the top technical analysis tools used globally and in different financial market for technical analysis include the following
-
The moving average
Moving average is a trend indicator used commonly by traders who seek to understand trend direction. They rely upon the moving average crossovers followed by a relative movement of candlesticks above or beneath the moving average. After a crossover, moving averages generate a bullish signal for a long position after the candlesticks are positioned above them. conversely, a short position signal is generated after a crossover if the candlesticks are positioned below the moving average. This makes it easy for traders 9even novices) to trade using the moving average.
-
Bollinger bands
The Bollinger band is another trend indicator that is commonly used by traders to forecast price movement. They comprise three moving averages that have been programmed to work together from each other within a standard deviation of 20. These three moving averages are called the upper, middle and lower Bollinger bands. The upper and middle Bollinger band serves as the resistance and support respective provided ninety percent (90%) of the candlesticks are bounded within them. This gives a signal for an uptrend or long position. Also, when the candlesticks are between the middle and the lower Bollinger bands, they serve as resistance and support respectively provided ninety percent (90%) of the candlesticks are bounded within them. This gives a signal for a downtrend or short position.
-
Relative strength index (RSI)
The relative strength index is used to calculate the relative strength of a trend using the average price movement of a set period. For instance, if the period of RSI is set to 14, such will calculate the strength of the 14 candles and extrapolate the average strength to signal either a strong, dwindling or weak bullish/bearish influence. If the bullish force is dwindling, such may result in a divergence. If the bearish force is weakening, such may lead to a convergence. Either way, the RSI is an indicator that helps traders prepare for a change in trend using the convergence/divergence concept of price strength.
It will be worthy to note that the concept of overbought and oversold positions when using the RSI is relative in meaning. It does not always work. Overbought or oversold positions do not mean a trader should take trades. What they rather imply is that price has gotten to the peak point of volatility depending on the timeframe upon which the trader is. For that reason, when the RSI gets to overbought or oversold positions, it is always advisable to go to the next closest higher timeframe closer since higher timeframes give a good reflection of a broader and long-term price direction.
-
The moving average convergence-divergence (MACD)
The moving average divergence convergence is an oscillator that functions similarly like the RSI. It compromises a mountain and valley structure separated by a median line. The median line serves to demarcate an uptrend from a downtrend. For that reason, when many traders observe that the MACD line has crossed the line, they assume that a bullish trend has set in and vice versa. Although MACD is primarily used in observing divergence and convergence, such can also grant early entry and exit in a trade when the moving average makes a crossover with the mountain or valley zones in the application.
-
Trendlines
Trendlines are diagonal lines drawn in the swing zones of a trending market. They are called trendlines because they are lines which serves as guides and boundaries when price makes a trend. A trendline can either be an uptrend or downtrend trendline and can further be categorized as higher timeframe trendlines or lower timeframe trendlines. In an uptrend, a trendline serves as a support. Conversely, a trendline serves as resistance in a downtrend. In most situations, trendlines can be modified into short horizontal lines used in tracing the extreme points of each trend swing. Due to it simplicity, so many traders use it for analysis.
-
Custom indicators
Custom indicators are just like the other forms of indicators. However, these are tailored forms of applications developed by people to meet specific needs of a trader. They are called custom because they do not come with the inbuilt application. Rather they are developed either as robots, EAs etcetera to meet specific desires in which the inbuilt indicators do not meet. For that reason, many custom indicators are usually purchased and installed following a guide that comes with it
How to improve your trading journey using technical analysis
Improvement comes through practice. And practice can be achieved when a trader is disciplined to create and follow an effective work ethics. Work ethics simply means a routine; a day-to-day activity or those set of activities that brings exposure, awareness and opportunities.
For instance, when I began my trading career, one of my routine practices was to pick up a topic of interest and create a one-month study plan about it. I will download books, surf as many YouTube videos as I could and invest time on demo accounts to apply the knowledge I gathered from different tutors. Also, when I come in contact with a trader who is more proficient than I was, I will seek to learn from him. That way, I grew my knowledge and understanding about different subject topics in technical analysis. Till date, I still maintain my study ethics
The second way to improve in technical analysis is to keep a track record of trade history. This enables a trader to document observations, diagrams, successful and unsuccessful trade outcomes as well as the reasons behind them.
Just last month, a friend visited me and found me with over 80 new materials (books, videos and courses) I acquired for study. He asked what I will do with them and I answered by telling him that the results will show in a few weeks from now. Today, the results are beginning to speak because I made every opportunity count through intentional documentation. A true proof of an effective document is this article you are studying: it is a product of accumulated personal study of many years. Truly, an effective work ethics backed up with intentional documentation pays beyond imagining.
footnote
If this publication has been helpful to you and you desire to know more about what to takes to be successful in trading, kindly visit my YouTube channel at https://www.youtube.com/c/juvirtrades
For mentorship and coaching, you can contact me through email juvirtrades@gmail.com. Also, you can open a free demo/real account under the Deriv.com platform by clicking here
To join my free WhatsApp group, kindly use the link https://chat.whatsapp.com/HJ2Lz96W378BJVfsQ5nU2F You can also reach me through a direct call on +2348027790183
Disclaimer
Deriv offers complex derivatives, such as options and contracts for difference (“CFDs”). These products may not be suitable for all clients, and trading them puts you at risk. Please make sure that you understand the following risks before trading Deriv products: a) you may lose some or all of the money you invest in the trade, b) if your trade involves currency conversion, exchange rates will affect your profit and loss. You should never trade with borrowed money or with money that you cannot afford to lose.