Trading Crash and Boom can be a little bit complex and emotional, especially when you are a newbie or when you don’t have the right approach to the market. From the fear of not losing your money to the desperation of making more money from the market, there is just one thing that will scare you off the market or throw you off balance if you don’t approach the market the right way.
Don’t be left out, Learn how to trade forex the right way, Click here to get started
Trading Crash and Boom and other synthetic Indices for me was very rough in the beginning, I made lots of mistakes and lost some money in the process. Sometimes I thought of quitting which for me was not the best idea, so I became very intentional to learn the process and arrived at the strategy I am about to share with you, which actually changed my perspectives about trading.
Let look at the 5 Steps To Growing Your Account Trading Crash And Boom
Table of Contents
How to approach Crash and Boom Market
Trading synthetic indices especially Crash and Boom is a function of Technical Analysis, not much of Sentimental Analysis or Fundamental analysis influencing the price of the asset. A good understanding in Technical Analysis will give you an advantage on how to trade crash and boom, which I strongly recommend that you get a good knowledge in Technical Analysis.
Don’t be left out, Open a free trading account now by clicking here
5 Essential Check List Before You Place a Trade.
These steps are going to form a basic checklist for both Scalpers and Swing traders.
1. The Trend, Your Friend
Before you place you trade the first and most important thing to consider is the trend of the market. The primary trend tells us who is dominant in the market.
There are basically three types of dominant trend which you must take note of before you actually place a trade, these include:
- Uptrends also known as the bullish trend. The uptrend form Higher highs and Higher lows. In a uptrend the buyers are dominant. The price momentum is upward.
- Downtrends also known as the bearish trend. The downtrend forms Lower lows and Lower highs. In a downtrend the sellers are dominant. The price momentum is downward.
- Consolidation: this is also known as a ranging trend. During consolidation no lower low or Higher high are formed. These shows that the buyers and the sellers and indecisive and the price keeps ranging sideways. This is not always a good time to trade..
Being a friend with the trend will make any strategy the best strategy, although this alone is not what you need to be successful.
2. Market Structure: crash and boom indices plays out according to different market Structures.
Finding areas of support and resistance both horizontal and diagonal will give you areas of entry and exit.
Support and resistance are areas of accumulations and and distribution respectively where price bounce off. They provide potential price for entry and exit.
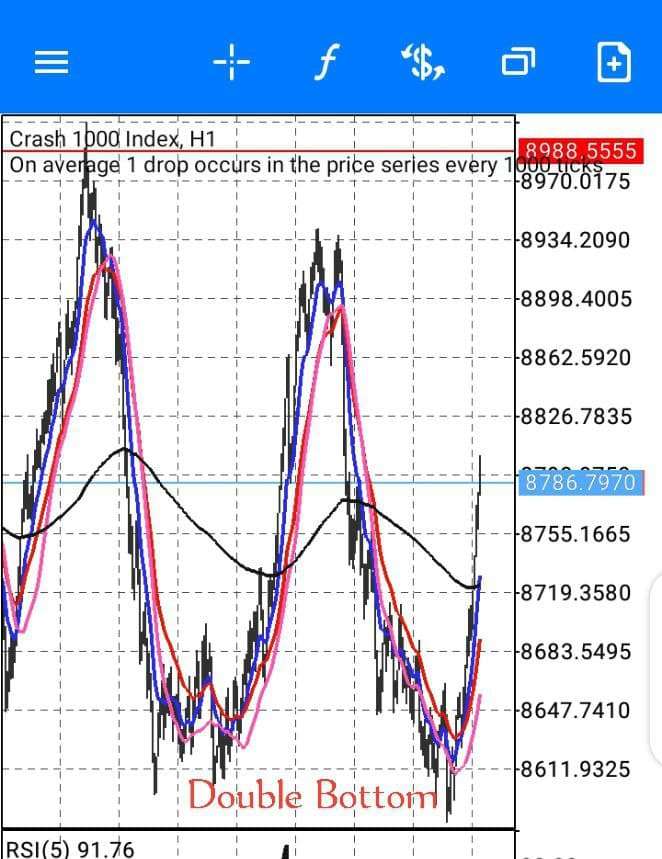
Other market Structures such as double or triple bottom, double or triple top, Head and shoulder, Flag patterns, Divergence are very important to look out for before you place your order. Crash and Boom always respect market Structures.


Allow a well known structure to play out before placing your orders. Whatever structure you are not familiar with avoid it, this is how to stay on top of the game.
- Pullbacks: these are key reversal level where price retest to before price continuation. A trend is made up of Impulsive or corrective trend. The impulsive trend has the power to drive the trend and formed the dominant moves in the market. The corrective trend are the retest non- dominant trend. The corrections forms higher low for a bullish trend and a low high for a bearish trend.
3. Moving Average Crosses
Moving Averages helps you identify support or resistance as well as the current market trend.

Here, I will be recommending the 200 EMA, 10 SMA, 22 EMA.
The 200 EMA serves as Support and Resistance. When the 200 EMA crosses below the candles sticks it indicates an uptrend. When the 200 EMA crosses above the candles sticks it indicates a downtrend. When the 10 SMA and 22 EMA crosses each other depending on the trend of the market it gives us an entry for either a buy or a sell. The MA crosses gives us a close entry when when analyzing with a smaller timeframe and a trend confirmation when analyzing with a higher timeframe.
4. The Loading Strategy
The Loading Strategy is perfect for scalping. There is a little or no draw down using this strategy. The strategy was discovered by a guru Synthetic indices trader, Michael Essien, He calls it Extensive Exhaustion Point (EEP).
The EEP strategy uses RSI 6, on the following levels: 90, 85, 70, 50, 15, and 10. When the RSI oscillator reaches level 90 on 5 minutes timeframe you make an entry for a sell in crash, and when the RSI oscillator gets to level 10, you make your entry for a buy in Boom.
This strategy will make you some good money if you follow the the instructions in the video patiently.
5. Emotional Control.
This is the fundamental part of trading, you will not make money if you can not control your emotions.
- Do not trade if by emotions. Set a daily target for yourself and avoid the market once that target is achieved.
- Do not fight back the market if you made loses or if you had a bad day.
- Do not place a trade because you met the market buying or selling, always allow your strategy to play out before you make place your order.
- Do not be too exited to open risk. Use proper risk management when trading.
- Never allow a winning trade to become a losing trade. know it exit the market and keep it simple.
- Get an appropriate mentorship before investing in trading. Trading involves high level risk, especially the risk of losing your money.
Join our mentorship program today and improve your financial status in less than six month. also, stand the chance of learning all our trading skills and stay on top of the game.
To join click the mentorship program, click here
You can also join a 5 month trading challenge and raise your $100 to $3000 in less than 5 month with a minimum of $20 daily target. you don’t have to know how to trade to join this challenge, you will only have to copy our daily trades calls and make a your daily target from it.
Disclaimer
Deriv offers complex derivatives, such as options and contracts for difference (“CFDs”). These products may not be suitable for all clients, and trading them puts you at risk. Please make sure that you understand the following risks before trading Deriv products: a) you may lose some or all of the money you invest in the trade, b) if your trade involves currency conversion, exchange rates will affect your profit and loss. You should never trade with borrowed money or with money that you cannot afford to lose.