Few months ago, we developed the Bollinger band and Ichimoku scalping strategy for Boom and Crash. Combining two powerful indicators, we were able to come up with a simple but powerful strategy that can assist traders make informed trading decisions when they are trading against the spikes in Boom and crash.
Don’t be left out, Learn how to trade forex the right way, Click here to get started
If you have followed my teaching, I am not fan of indicators, but this strategy became very necessary because of various request from struggling forex traders who are looking for the easy way out especially with the prevailing global economic situation.
Table of Contents
Bollinger Band and Ichimoku Scalping Strategy for Boom and Crash
What are Bollinger Bands?
Bollinger Bands are trading tool which consist of 3 lines; the upper band, middle band and lower band. The upper band is used to identify the high of price on a chart, the middle band reflect the intermediate-term trend while the lower band identify the low of price on a chart.
Bollinger Bands was created by John Bollinger in the early 1980s, and it is a trading tool use in forex, commodities, equities, etc., to assist traders to make good trading decisions. Just like other indicator, the Bollinger band is a good technical indicator if used correctly, it can help you spot good trading setup.
How Does the Bollinger Band Works
- Bollinger Band measure a market’s volatility and identify “overbought” or “oversold” conditions.
- When the price is quiet, the bands are close together. When the price moves up, the bands spread apart
- One thing you should know about Bollinger Bands is that the price tends to return to the middle of the bands.
- Bollinger bands act like dynamic support and resistance levels.
What are the Ichimoku Cloud?
The Ichimoku Cloud on the other hand was developed by Goichi Hosoda, a Japanese journalist, and published in the late 1960s. The Ichimoku chart provides some essential information like trend direction and momentum, support and resistance levels which can assist traders to make informed trade decisions.
Don’t be left out, Open a free trading account now by clicking here
How Does the Ichimoku indicator works?
- The Ichimoku indicator takes multiple averages of support and resistance, trend direction and momentum and plot them on a chart
- The otrend is up when the price is above the cloud, down when the price is below the cloud, and consolidating when the price is in the cloud
- The Ichimoku indicator provides more data points than the standard candlestick chart
- The Ichimoku Cloud is composed of five lines two of which comprise a cloud where the difference between the two lines is shaded in
The Indicator Settings
- Add Bollinger Band to the main Chart (the setting is on the screenshot below)

- Add Parabolic Sar to the Main chart (setting below)

- Add Relative Strength Index (RSI) to the Chart

- Add Ichimoku to Indicator 1

How the Bollinger Band and Ichimoku Scalping Strategy for Boom and Crash
- Determine the trend of the market on H4 and H1, once you have established the trend, switch to M1, because this strategy is mainly for scalping.
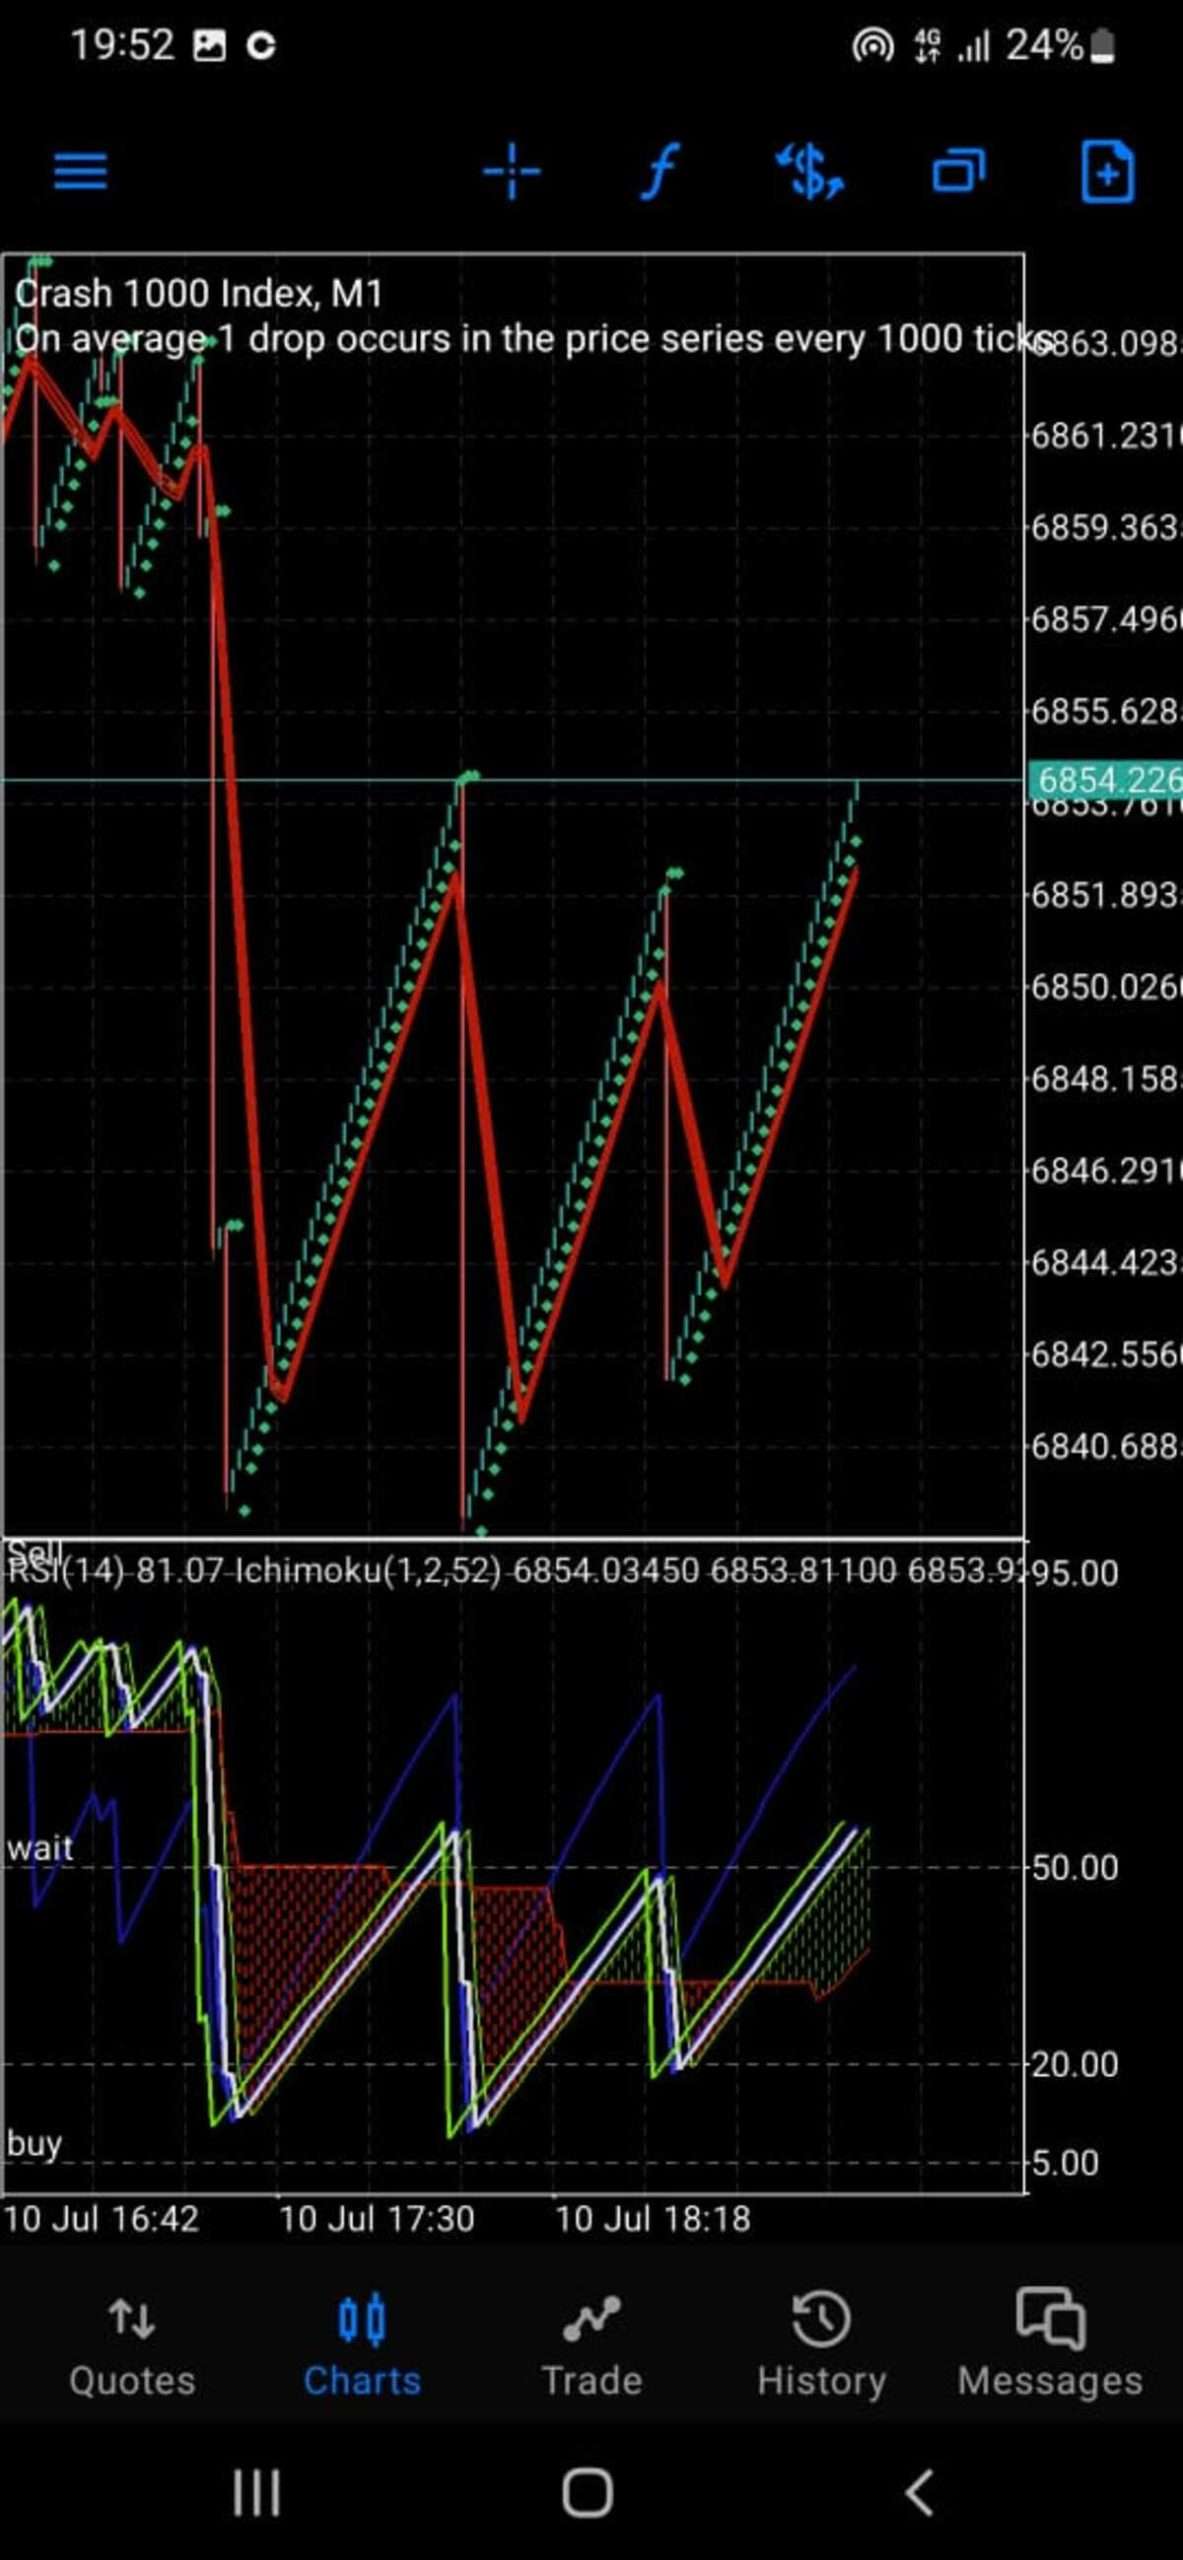
- For Boom Sell, the first confirmation is when the price is below the Bollinger band (as indicated on the screenshot below). The confirmation for a sell comes when the color of the ichimoku on indicator 1 change from green to red. Once you see the confirmation, you can sell. Take few candles and leave the market, then wait for another set up

- For Crash Buy, once the price is above the Bollinger band and the ichimoku color changes from red to green (as shown in the screenshot below), you can buy, take few candles and leave the market, then wait for another set up.

Things to Note
- This strategy has been proven to be 99% especially when you know the trend of the market.
- Wait for the two confirmation before taking a sell on boom or a buy on crash
- Use proper risk management
- Always note your major support and resistance level and avoid those zones.
- Test the strategy on your demo before using with your real account, if you don’t have a demo, click here to create one.
Final Thoughts
Trading Forex is risky, work on your trading psychology, have a daily target and be sure to follow all the rules in your trading strategy. If you have any question, kindly share below.
Risk Disclaimer
Deriv offers complex derivatives, such as options and contracts for difference (“CFDs”). These products may not be suitable for all clients, and trading them puts you at risk. Please make sure that you understand the following risks before trading Deriv products: a) you may lose some or all of the money you invest in the trade, b) if your trade involves currency conversion, exchange rates will affect your profit and loss. You should never trade with borrowed money or with money that you cannot afford to lose.
Am from kenya,can i start trading on crash 1000 index with 10$ in my account
No you need $10,000.00
انا من العراق كيف يمكنني تحديد نقطة بيع كراش 30
Pls can u do a video on it