Let’s talk about trends! As a trading beginner, you might be looking for a straightforward trading strategy to kickstart your career. The trend is your friend. I will speak about my experience in trend trading, trend trading strategy, and entry/exit positions. By the end of this article on trend trading strategy you will be able to understand what a trend is and how to use it to your advantage.
Table of Contents
How I Grew my Forex Account with Trend Trading Strategy
What is a trend?
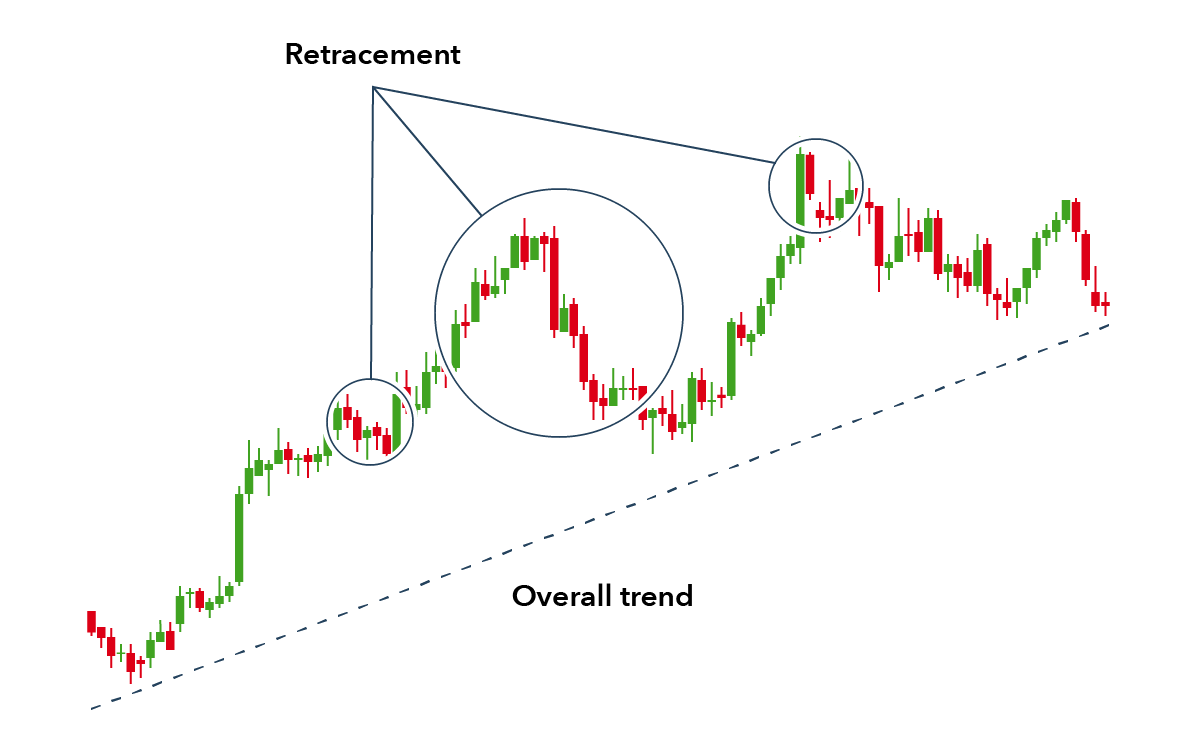
A trend is formed when prices move in a particular direction over a period. A trend can be long, short, downward, upward, or sideways. Trend traders must identify trends and enter their positions as potentially profitable entry and exit positions.
An uptrend tends to have higher swing highs and higher swing lows, each more elevated than the last one. A downtrend tends to have lower swing lows and lower swing highs, each lower than the last one.
Trend trading strategies
Trend trading is straightforward in theory, but when you begin, you understand that a lot of practice and discipline is required to master these strategies. Like many other professional traders, I trade in favor of the trend. Yes, I aim for the continuation of the current trend.
Trend reversals also present trading opportunities. However, traders should be very cautious of them. The trend is likely to continue long enough to give great trading opportunities in ideal conditions.
Technical indicators come in handy when predicting the market direction.
Here are the four best trading strategies that I like to use.
-
Moving average crossover strategy
Here, I use the moving average (MA) technical indicator. This strategy is simple and ideal for beginners. Simple moving averages (SMAs) help you identify trends by showing you the historical price movements of the asset.
When using the moving average crossover strategy, I use three SMAs with periods of 9, 21, and 50. You can use other SMAs, provided they have the same configurations, for instance, 10, 20, and 50. The strategy is ideal for all timeframes and any market type. Therefore, it is also suitable for swing traders and day traders.
To get profitable with this strategy, follow the following steps:
- The 50 Moving Average helps understand the market’s general direction and get potential entry positions. In an uptrend, the 50 MA is usually below the price action. In a downtrend, the 50 MA is generally above the price action.
- The 50 MA is the slowest MA. Once you see whether it falls below or above the price action, now it is time to wait for the 9 MA to cross with the 21MA. When the 50 MA falls below the price action, enter a long position once the 9 MA crosses the 21 MA from bottom to top. If the 50MA is above the price, go short when the 9 MA crosses with the 21 MA from top to bottom.
- Place your stop-loss near the 50 MA or at the closest resistance point positions or support depending on the trend direction. Watch the price action to exit the position if the 9 MA and 21 MA cross again.
Bollinger Band Strategy
For this strategy, use Bollinger bands with exponential moving average (EMA) period 50. The 50 MA helps us understand the general trend direction and get potential entry points.
The basic rule for using this strategy is to go long when the price moves above the Bollinger bands mid-band and go short when the price moves below the Bollinger band. However, let me add more information to help you make better signals.
In an uptrend, try this method.
- Wait for the price action to be above 50 MA
- A bullish candle grows above the mid-band
- When the price action is above 50 MA and a bullish candle forms above the mid-band, it indicates a bullish market.
- Set your stop loss below the mid-band or at the 50 EMA
- You can choose to exit when the price action reaches the upper band or wait until the price falls back from the upper band.
MACD crossover
I use the moving average convergence divergence (MACD) as an oscillator and trend indicator. For this strategy, what we are ideally looking for is crossovers. Put the following settings on your chart:
- Add the MACD with default settings, that is, 12 and 16
- set a slow 200 MA
This strategy is ideal for the 30 minutes and one-day timeframes. The slow MA helps tell the trend direction. In an uptrend, look for when the prices are above the 200 MA. In a bearish market, look for when the price is below the 200 MA.
For short positions:
- Wait for when the price is below 200 MA
- Wait for when the MACD crosses the signal line from top to bottom. The MACD line is blue, and the signal line is orange
- Place your stop loss at the nearest resistance level
- Monitor the chart to close your position in case the MACD lines cross above the signal line, as this could be an indication of a trend reversal
Final Thought
To be successful in trading, you need to understand price action, as it will lay a solid foundation for your trading journey. Please this article is for education purpose, always try every strategy on your demo account before trading with your real account.
Disclaimer
Deriv offers complex derivatives, such as options and contracts for difference (“CFDs”). These products may not be suitable for all clients, and trading them puts you at risk. Please make sure that you understand the following risks before trading Deriv products: a) you may lose some or all of the money you invest in the trade, b) if your trade involves currency conversion, exchange rates will affect your profit and loss. You should never trade with borrowed money or with money that you cannot afford to lose.

