


Trading the financial markets can be a very rewarding adventure if a trader knows how to use and understand certain trading tools that have been provided for him. For instance, in todays’ world, there are many online examples, books, strategies, courses, robots and other developed tools that has made trading progress from a mentally tasking adventure to one in which he/she employs certain parameters to make money. One of such tools which makes trading a worthwhile adventure is the Fibonacci tool.
Learn the Secret of Forex Trading, Click here to download a free e-book now
Table of Contents
What is the Fibonacci tool?
The Fibonacci tool is one of the price action tools which is used to forecast retracement and future price levels. It was developed by an Italian Mathematician, Leonardo Fibonacci in the 12th Century. It comprises series of numbers that represents retracement and extension levels; and are arranged in an increasing order of sequence. These numbers include 0.00, 23.60%, 38.20%, 50%, 61.8%, 78.6%, 100%, 127.20%, 141.40%, 161.80%, 227.20%, 241.40%, 261.80%, 327.20%, 341.40%, 361.80% etc.


Figure 1: Showing the Fibonacci Tool with Retracement and Extension Levels
Since the discovery of the Fibonacci tool, so many traders have adopted it for extensive use as a price action (naked chart) tool for trading; most of whose testimonials have recorded great successes for decades due to the precise entry and exit points it helps traders to see and forecast from the market.
Components of the Fibonacci tool
The Fibonacci tool comprise the Fibonacci retracement and extension levels. These levels are used extensively thus:
- The Fibonacci retracement: this comprises numbers below 100% (23.60%, 38.20%, 50%, 61.8%, 78.6% etc.,).
- The Fibonacci extension: this comprises numbers above 100% (100%, 127.20%, 141.40%, 161.80%, 227.20%, 241.40%, 261.80%, 327.20%, 341.40%, 361.80% etc.,).

Figure 2: Showing a Fibonacci Retracement Tool with its Levels


Figure 3: Showing a Fibonacci Extension Tools with its Levels
The Fibonacci retracement is used to measure or, forecast a pullback or retracement in an up or down trending market. It is often used because it offers a clue as to where traders can wait for price to give reversal signals; a clue for the resumption of the main trend.

Figure 4: Showing a 61.80% Fibonacci Retracement Level
For instance, if a trader was actively involved in trading Boom 1000 and would desire to know the extent to which the first wave of its trend had pulled back, the use of the Fib retracement tool enabled such to see that the pullback went as far as 61.80% as shown in figure 4.

Figure 5: Showing a 161.80% Fibonacci Extension Level
Unlike the Fibonacci retracement tool whose levels are used for retracement purposes, the Fibonacci extension is used to measure or, forecast a future price target in an up or down trending market. It is often used because it offers a clue as to where traders should expect price to get to in the future.

For instance, after the retracement (as shown in figure 4) had come to an end, there was a concurrent resumption in the main trend (as shown in figure 5). To forecast this future price levels, a trader could use the Fib extension tool to forecast price destination such that since the retracement could pull back to 61.8%, the future price target could be forecasted to buy up to 161.80%, which the price actually dad (Figure 5).
Learn the Secret of Forex Trading, Click here to download a free e-book now
This is to imply that with the use of Fib tool, a trader can forecast future prices of any financial asset to a near precision if used accordingly. The clue here is that, if a pullback gets to 38.20%, with the resumption of the main trend, probability is that the main trend should get to Fibonacci levels closest to it 138.20% (either 127.20%, 141.40%,) since there is no 138.20% Fib extension level. And as such, it is expected that swing and position traders will hold their trades for days knowing that as price progress through zones, it will definitely head to the estimated Fib extension level ceteris paribus. For scalpers, they can maximize on the trend as they filter through to take many trades on lower time frames.
How to use the Fibonacci tool
The Fibonacci tool has been employed for use either as a single trading strategy tool or in combination with other price action/indicator trading tools. As a single trading tool (either as a 1 Fib tool or as a 2 Fib tool as seen in Fib confluence trading), its retracements or extension levels are always placed on the support or/and resistance levels of a trend. In combination with other price action tools/indicators such as candlestick patterns and trendlines, the Fibonacci tool is used to determine when the main trend has resumed or ended.
For this to happen, a trader must know the following:
- A step-by-step knowledge of the market trend especially a good understanding of the swing highs and lows of an uptrend and downtrend.
To have a good understanding of swing highs and lows, a trader needs to focus on what I call the ‘’beginning and the end’’ of each wave in a trend. To do this, I always suggest that analysis must be done on higher time frames (Weekly, Daily and Hourly) and not on lower time frames (Minutes). This is because, higher time frames are directional time frames and tend to have a better resistance and support levels than lower time frames. The pictorial representation below (picture 6 and 7) goes on to buttress this point where swing highs (red zone) and lows (blue zone) were determined on the daily time frame of Boom 500 and 1000 chart.


Figure 6: Showing an uptrend swing high (Red zone) and low (red zone) of Boom 1000 chart

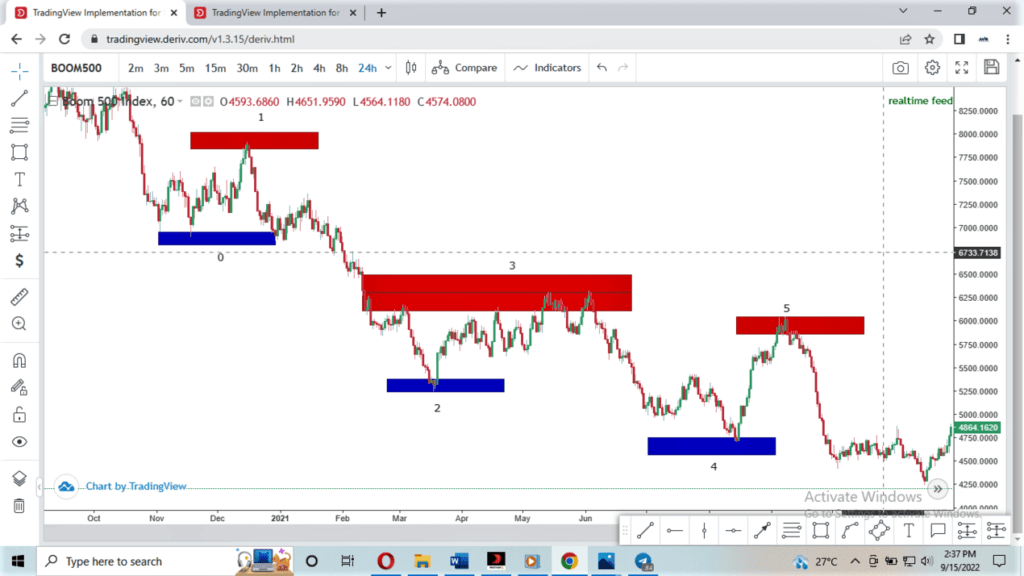
Figure 7: Showing a downtrend swing high (Red zone) and low (red zone) of Boom 500 chart
For more information on understanding swing highs and lows, a tutorial on https://youtu.be/H6Eec7a_87E has been prepared to solve that problem.
- After knowing the swing highs and lows of a trend, we place the Fib tool on them in a peculiar pattern. This is to follow the ideology that each trend wave represents 100% of the entire Fibonacci tool (that is from point 0 to point 100). For instance, in an uptrend, the swing low (Higher low) is the beginning of the trend. So, the 100% point is placed on the swing low (higher low). However, in using the Fib extension, the tool is flipped such that the 0 point now stands at the end of the trend (swing high or higher high) and the 0-point returns to the swing low (higher low) as shown in pictures below.


Conversely, in a downtrend, the swing high or lower high is the beginning of the trend thus, the 100-point is placed there while the end of the trend has point-0 to it. When analyzing for extension levels, the 100-point is placed at the end of the trend (lower low) and the 0-point on the lower high. That way, he extension levels can be easily determined as seen in pictures below
N/B: The rule is that
- Point 100 goes to the beginning of the trend in analyzing for retracement
- Point 100 goes to the end of the trend when analyzing for future price (extensions).
- Most times, price retracements do not occur perfectly on exact Fibonacci levels such that price could be found in between two levels. As such, a trader should understand that it is not out of place for this to happen. But, he/she should glean on this and trade confidently as shown in the picture 8 where the retracement level was found in between 61.80% and 78.60% (0.618 and 0.79)

Figure 8: Showing retracement levels in between 61.80% and 78.60% on Boom 1000 chart
Final Thoughts
- Please note, different traders have different ways of using Fibonacci as a tool to assist them pick high probability trades.
- Fibonacci retracement levels (0.618 and 0.79) gives you point of retracement, but you need to add your support and resistance tool for entry confirmation.
- Fibonacci extension level (0.27) can be used to determine a possible take profit level
- In drawing the Fibonacci retracement: for Downtrend; draw from recent high to recent low. Then for Uptrend; draw from recent low to recent high.
If this publication has been helpful to you and you desire to know more about synthetic indices trading, kindly visit my YouTube channel . For mentorship and coaching, you contact me through email juvirtrades@gmail.com. or direct call on +2348027790183. You can open a free demo account by clicking here. Click here to join my free Telegram group.
Risk Disclaimer
Deriv offers complex derivatives, such as options and contracts for difference (“CFDs”). These products may not be suitable for all clients, and trading them puts you at risk. Please make sure that you understand the following risks before trading Deriv products: a) you may lose some or all of the money you invest in the trade, b) if your trade involves currency conversion, exchange rates will affect your profit and loss. You should never trade with borrowed money or with money that you cannot afford to lose.