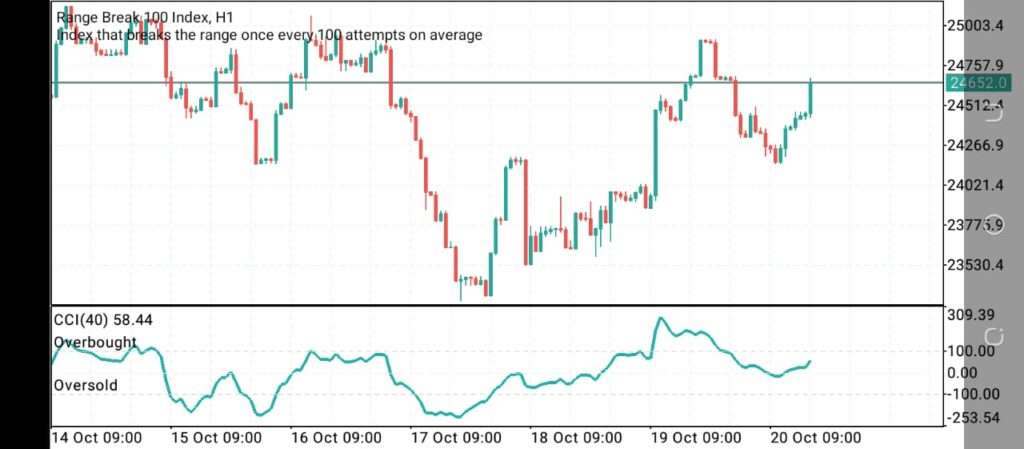
Last two week, I got a request to review the Range Break Indices, one of the Synthetic indices available for traders to trade on Deriv. I was reluctant to respond to the email at first, but after about 2 days, I sent a reply to the person with a promise that I will look at the market and respond to him accordingly.
Learn the Secret of Forex Trading, Click here to download a free e-book now
As a rule of thumb, trading Range break indices needs patience and a lot of practice, I will explain this later in this article but first let me explain the concept of this indices.
Table of Contents
What are Range Break Indices?
This indices fluctuate between two price points called borders, occasionally breaking through the borders to create a new range on average once every 100 (Range Break 100) or 200 (Range Break 200) times that they hit the borders. In a clear terms this indices form a range at some point, spike up or down to form another range at another point.
We can also say that range is characterized by fluctuation of price in a definable point over time. Meaning that in Range Break indices price will tend to fluctuate between both a support price and a resistance price before spiking either up or down.
How to trade the Range Break Indices
I have engaged with many top traders on this topic and the best available strategy for this indices is Price action trading strategy. However, in the last one week, I have used Alligator (13, 8, 5) and Stochastic (1,1,1) to support my price action analysis on trading this asset with 90.1 % success rate.
In using Stochastic, I trade mostly with M15 timeframe after a careful analysis on higher timeframe. I have a big equity account so I will advise, if you use a small account you can stick with M5 timeframe.
As indicated on the picture above, I take my sell entry when the Alligator line crosses the 80 level on the Stochastic indicator on M15 and buy entry when the alligator line crosses the 20 level of the stochastic indicator. The secret to success is patience, once you understand the direction of the market based on price action on higher timeframe, you have to put your stop loss slightly above the previous high for sell or slightly below the previous low for a buy incase of a breakout.
Things to Note while trading this indices
1. Practice your strategy on a Demo account first and Monitor the process.
If you don’t have a demo account, click here to open one.
2. Learn the concept of Price action trading: You need to understand the market structure and take action at the appropriate time.
3. Patience and practice is key, once you understand the trend and the direction of the market, place your trade with accurate stop loss and Take profit.
4. Be careful of small gains; jumping in to get few cents when you don’t understand the trend is risky. understand the trend first before you employ your scalping strategy.
5. Greed is not your friend; once you are in good profit, close and rest for the day. It important to know when to close in profit or loses when you are trading Range 100 or Range 200.
In conclusion; the moving average on the chart is 200 EMA, I love using the 200 EMA, it helps in trend direction, support and resistance.
N:B: Please Practice on Demo first before trading on Live account. Trading Range is risky when you don’t understand the market. if you have question, kindly drop a comment below this post
Disclaimer
Deriv offers complex derivatives, such as options and contracts for difference (“CFDs”). These products may not be suitable for all clients, and trading them puts you at risk. Please make sure that you understand the following risks before trading Deriv products: a) you may lose some or all of the money you invest in the trade, b) if your trade involves currency conversion, exchange rates will affect your profit and loss. You should never trade with borrowed money or with money that you cannot afford to lose.

