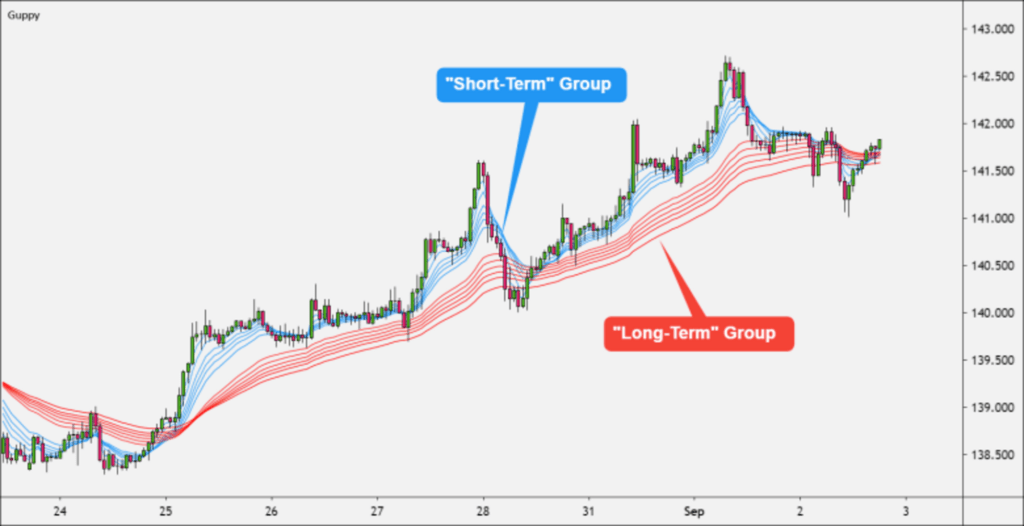
GUPPY Multiple Moving Average is a technical indicator that identifies potential change in market trend. When used correctly, it can help in spotting great trading opportunities. Most traders use GUPPY Multiple Moving Average in conjunction with price action analysis in order to confirm their entries position.
As I have discussed in my previous write ups, nearly all forex indicators are lagging, mostly because they can represent price change in the past accurately but cannot predict future price change adequately or as fast as you may want. That is while even with the best indicator, you may still find yourself struggling to make good trades decision if you don’t add an element of price action to your trade analysis.
Don’t be left out, Open a free trading account now by clicking here
Don’t worry in this article, I am going to share some insight that will assist you to adequately predict good entry points using GUPPY Multiple Moving Average and price action.
Table of Contents
What is GUPPY Multiple Moving Average?
GUPPY Indicator was coined by Daryl Guppy, an Australian financial columnist, it consist of a group of short term and long term EMAs with different time periods with the aim of identifying potential change in market trend. The short term group of EMAs can include 3, 5, 8, 10, 12 and 15 time periods while the long term group of EMAs can include 30, 35, 40, 45, 50 and 60
According to Guppy indicator; for an uptrend, the short term groups of EMA needs to be above the long term groups of EMA in order for you to enter buy positions, while the reverse is the case for Downtrend.
How I trade with GUPPY
I have used the GUPPY Multiple Moving Average multiple times in analyzing Boom and Crash and the outcome is always good. To get the right entry for Boom and Crash, I used 5 short term EMAs (1,2,3,4,5) and 5 long term EMAs (14, 35,50,100, 200).
The combination of these EMAs can show you great historical perspective of the market, but to make trade decisions, you need to draw your trendlines, and also draw support and resistance line. Personally, I draw my trendline using the 4 hour timeframe, then monitor the chart on 15 minutes or 5 minutes timeframe.
To identify the trend
- Once price action breaks my trendline upward and the short term EMAs are above the long term EMAs, I will start looking for buy position at the next support zone.
- Once price action breaks my trendline downward and the long term EMAs are above the short term EMAs, I will start looking for sells positions.
To Identify Trend Strength
The GUPPY indicator can also be used to spot trend strength. To know a strong trend, the different between the Short EMAS and Long EMAs will be wide, while a close or a narrow difference between short and long term EMA will signal consolidation.
To Identify Change in trend
A cross over of the short EMAs with the long EMAs to upside, identify buys opportunity, while a cross over of the long EMAS with the short EMA downward indicates a sell opportunity.
Final Thoughts
To set up the indicator, add Exponential moving average 1, 2,3, 4 and 5 (short term EMAs) on the main chart; and also add Exponential Moving average 14, 35,50,100, 200. (long term EMAs)
Then add RSI period 1000; level 85 and 10. Finally add the short term EMA to indicator window 1 (where you have the RSI). Don’t make trade decision using only GUPPY, use some element of price action like trendline, support and resistance too to confirm your entry point.
Also Read: RSI and EMA spike Catching strategy for Boom and Crash
Disclaimer
Deriv offers complex derivatives, such as options and contracts for difference (“CFDs”). These products may not be suitable for all clients, and trading them puts you at risk. Please make sure that you understand the following risks before trading Deriv products: a) you may lose some or all of the money you invest in the trade, b) if your trade involves currency conversion, exchange rates will affect your profit and loss. You should never trade with borrowed money or with money that you cannot afford to lose.

